Thermal Expansion

Thermal Expansion

Introduction

When heat is applied to most materials, expansion occurs in all directions. Conversely, if heat energy is removed from a material (i.e. the material is cooled) contraction occurs in all directions. The effects of expansion and contraction each depend on the change of temperature of the material.

Practical Applications of Thermal Expansion

Some practical applications where expansion and contraction of solid materials must be allowed for include:

(i) Overhead electrical transmission lines are hung so that they are slack in summer, otherwise their contraction in winter may snap the conductors or bring down pylons.

(ii) Gaps need to be left in lengths of railway lines to prevent buckling in hot weather (except where these are continuously welded).

(iii) Ends of large bridges are often supported on rollers to allow them to expand and contract freely.

(iv) Fitting a metal collar to a shaft or a steel tyre to a wheel is often achieved by first heating them so that they expand, fitting them in position, and then cooling them so that the contraction holds them firmly in place; this is known as a ‘shrink-fit’. By a similar method hot rivets are used for joining metal sheets.

(v) The amount of expansion varies with different materials. Figure 30.1(a) shows a bimetallic strip at room temperature (i.e. two different strips of metal riveted together). When heated, brass expands more than steel, and since the two metals are riveted together the bimetallic strip is forced into an arc as shown in Figure 30.1(b). Such a movement can be arranged to make or break an electric circuit and bimetallic strips are used, in particular, in thermostats (which are temperature-operated switches) used to control central heating systems, cookers, refrigerators, toasters, irons, hot water and alarm systems.

(vi) Motor engines use the rapid expansion of heated gases to force a piston to move.

(vii) Designers must predict, and allow for, the expansion of steel pipes in a steam-raising plant so as to avoid damage and consequent danger to health.

Expansion and Contraction of Water

Water is a liquid that at low temperature displays an unusual effect. If cooled, contraction occurs until, at about 4°C, the volume is at a minimum. As the

image

temperature is further decreased from 4°C to 0°C expansion occurs, i.e. the volume increases. When ice is formed, considerable expansion occurs and it is this expansion that often causes frozen water pipes to burst.

A practical application of the expansion of a liquid is with thermometers, where the expansion of a liquid, such as mercury or alcohol, is used to measure temperature.

Coefficient of Linear Expansion

The amount by which unit length of a material expands when the temperature is raised one degree is called the coefficient of linear expansion of the material and is represented by ˛ (Greek alpha).

The units of the coefficient of linear expansion are m/(mK), although it is usually quoted as just /K or KÐ1. For example, copper has a coefficient of linear expansion value of 17 ð 10Ð6 KÐ1, which means that a 1 m long bar of copper expands by 0.000017 m if its temperature is increased by 1 K (or 1°C). If a 6 m long bar of copper is subjected to a temperature rise of 25 K then the bar will expand by (6 ð 0.000017 ð 25) m, i.e. 0.00255 m or 2.55 mm. (Since the kelvin scale uses the same temperature interval as the Celsius scale, a change of temperature of, say, 50°C, is the same as a change of temperature of 50 K).

If a material, initially of length l1 and at a temperature of t1 and having a coefficient of linear expansion ˛, has its temperature increased to t2, then the new length l2 of the material is given by:

image

For example, the copper tubes in a boiler are 4.20 m long at a temperature of 20°C. Then, when surrounded only by feed water at 10°C, the final length of the tubes, l2, is given by:

image

Coefficient of Superficial Expansion

The amount by which unit area of a material increases when the temperature is raised by one degree is called the coefficient of superficial (i.e. area) expansion and is represented by ˇ (Greek beta).

If a material having an initial surface area A1 at temperature t1 and having a coefficient of superficial expansion ˇ, has its temperature increased to t2, then the new surface area A2 of the material is given by:

image

It may be shown that the coefficient of superficial expansion is twice the coefficient of linear expansion, i.e. ˇ D 2˛, to a very close approximation.

Coefficient of Cubic Expansion

The amount by which unit volume of a material increases for a one degree rise of temperature is called the coefficient of cubic (or volumetric) expansion and is represented by y (Greek gamma).

If a material having an initial volume V1 at temperature t1 and having a coefficient of cubic expansion y, has its temperature raised to t2, then the new volume V2 of the material is given by:

image

It may be shown that the coefficient of cubic expansion is three times the coefficient of linear expansion, i.e. y D 3˛, to a very close approximation.

A liquid has no definite shape and only its cubic or volumetric expansion need be considered. Thus with expansions in liquids, equation (3) is used.

Some typical values for the coefficient of cubic expansion measured at 20°C

(i.e. 293 K) include:

image


Heat Energy

Heat Energy

Introduction

Heat is a form of energy and is measured in joules.

Temperature is the degree of hotness or coldness of a substance. Heat and temperature are thus not the same thing. For example, twice the heat energy is needed to boil a full container of water than half a container — that is, different amounts of heat energy are needed to cause an equal rise in the temperature of different amounts of the same substance.

Temperature is measured either (i) on the Celsius (°C) scale (formerly Centigrade), where the temperature at which ice melts, i.e. the freezing point of water, is taken as 0°C and the point at which water boils under normal atmospheric pressure is taken as 100° C, or (ii) on the thermodynamic scale, in which the unit of temperature is the kelvin (K). The kelvin scale uses the same temperature interval as the Celsius scale but as its zero takes the ‘absolute zero of temperature’ which is at about Ð273° C. Hence,

image

The Measurement of Temperature

A thermometer is an instrument that measures temperature. Any substance that possesses one or more properties that vary with temperature can be used to measure temperature. These properties include changes in length, area or volume, electrical resistance or in colour. Examples of temperature measuring devices include:

(i) liquid-in-glass thermometer, which uses the expansion of a liquid with increase in temperature as its principle of operation

(ii) thermocouples, which use the e.m.f. set up when the junction of two

dissimilar metals is heated

(iii) resistance thermometer, which uses the change in electrical resistance caused by temperature change, and

(iv) pyrometers, which are devices for measuring very high temperatures, using the principle that all substances emit radiant energy when hot, the rate of emission depending on their temperature.

Each of these temperature measuring devices, together with others, are described in Chapter 31.

Specific Heat Capacity

The specific heat capacity of a substance is the quantity of heat energy required to raise the temperature of 1 kg of the substance by 1°C.

The symbol used for specific heat capacity is c and the units are J/(kg °C) or J/(kg K). (Note that these units may also be written as J kgÐ1 °CÐ1 or J kgÐ1 KÐ1)

Some typical values of specific heat capacity for the range of temperature 0°C to 100° C include:

image

Hence, to raise the temperature of 1 kg of iron by 1°C requires 500 J of energy, to raise the temperature of 5 kg of iron by 1°C requires (500 ð 5) J of energy, and to raise the temperature of 5 kg of iron by 40°C requires (500 ð 5 ð 40) J of energy, i.e. 100 kJ

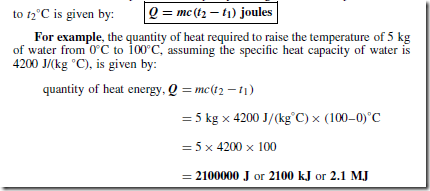
In general, the quantity of heat energy, Q, required to raise a mass m kg of a substance with a specific heat capacity c J/(kg °C) from temperature t1°C
image

Change of State

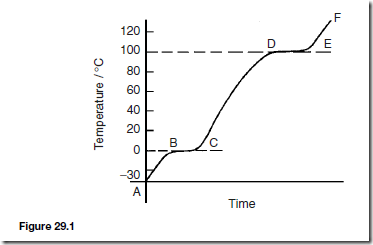
A material may exist in any one of three states — solid, liquid or gas. If heat is supplied at a constant rate to some ice initially at, say, Ð30°C, its temperature rises as shown in Figure 29.1. Initially the temperature increases from Ð30°C to 0°C as shown by the line AB. It then remains constant at 0°C for the time BC required for the ice to melt into water.

When melting commences the energy gained by continual heating is offset by the energy required for the change of state and the temperature remains constant even though heating is continued. When the ice is completely melted to water, continual heating raises the temperature to 100°C, as shown by CD in Figure 29.1. The water then begins to boil and the temperature again remains constant at 100°C, shown as DE, until all the water has vaporised.

Continual heating raises the temperature of the steam as shown by EF in the region where the steam is termed superheated.
image

Changes of state from solid to liquid or liquid to gas occur without change of temperature and such changes are reversible processes. When heat energy flows to or from a substance and causes a change of temperature, such as between A and B, between C and D and between E and F in Figure 29.1, it is called sensible heat (since it can be ‘sensed’ by a thermometer).

Heat energy which flows to or from a substance while the temperature remains constant, such as between B and C and between D and E in Figure 29.1, is called latent heat (latent means concealed or hidden).

Latent Heats of Fusion and Vaporisation

The specific latent heat of fusion is the heat required to change 1 kg of a substance from the solid state to the liquid state (or vice versa) at constant temperature.

The specific latent heat of vaporisation is the heat required to change 1 kg of a substance from a liquid to a gaseous state (or vice versa) at constant temperature.

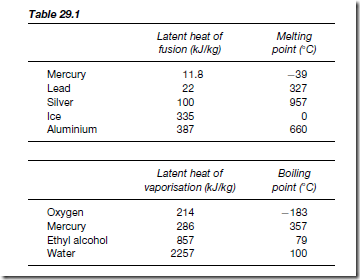
The units of the specific latent heats of fusion and vaporisation are J/kg, or more often kJ/kg, and some typical values are shown in Table 29.1

The quantity of heat Q supplied or given out during a change of state is given by:

Q = mL

where m is the mass in kilograms and L is the specific latent heat.

For example, the heat required to convert 10 kg of ice at 0°C to water at 0°C is given by 10 kg ð 335 kJ/kg D 3350 kJ or 3.35 MJ.

Besides changing temperature, the effects of supplying heat to a material can involve changes in dimensions, as well as in colour, state and electrical resistance. Most substances expand when heated and contract when cooled, and there are many practical applications and design implications of thermal movement (see Chapter 30).
image

Principle of Operation of a Simple Refrigerator

The boiling point of most liquids may be lowered if the pressure is lowered. In a simple refrigerator a working fluid, such as ammonia or freon, has the pressure acting on it reduced. The resulting lowering of the boiling point causes the liquid to vaporise. In vaporising, the liquid takes in the necessary latent heat from its surroundings, i.e. the freezer, which thus becomes cooled. The vapour is immediately removed by a pump to a condenser that is outside of the cabinet, where it is compressed and changed back into a liquid, giving out latent heat. The cycle is repeated when the liquid is pumped back to the freezer to be vaporised.

Conduction, Convection and Radiation

Heat may be transferred from a hot body to a cooler body by one or more of three methods, these being: (a) by conduction, (b) by convection, or (c) by radiation.

Conduction

Conduction is the transfer of heat energy from one part of a body to another (or from one body to another) without the particles of the body moving.

Conduction is associated with solids. For example, if one end of a metal bar is heated, the other end will become hot by conduction. Metals and metallic alloys are good conductors of heat, whereas air, wood, plastic, cork, glass and gases are examples of poor conductors (i.e. they are heat insulators).

Practical applications of conduction include:

(i) A domestic saucepan or dish conducts heat from the source to the contents.

Also, since wood and plastic are poor conductors of heat they are used for saucepan handles.

(ii) The metal of a radiator of a central heating system conducts heat from the hot water inside to the air outside.

Convection

Convection is the transfer of heat energy through a substance by the actual movement of the substance itself. Convection occurs in liquids and gases, but not in solids. When heated, a liquid or gas becomes less dense. It then rises and is replaced by a colder liquid or gas and the process repeats. For example, electric kettles and central heating radiators always heat up at the top first.

Examples of convection are:

(i) Natural circulation hot water heating systems depend on the hot water rising by convection to the top of the house and then falling back to the bottom of the house as it cools, releasing the heat energy to warm the house as it does so.

(ii) Convection currents cause air to move and therefore affect climate.

(iii) When a radiator heats the air around it, the hot air rises by convection and cold air moves in to take its place.

(iv) A cooling system in a car radiator relies on convection.

(v) Large electrical transformers dissipate waste heat to an oil tank. The heated oil rises by convection to the top, then sinks through cooling fins, losing heat as it does so.

(vi) In a refrigerator, the cooling unit is situated near the top. The air sur-

rounding the cold pipes become heavier as it contracts and sinks towards the bottom. Warmer, less dense air is pushed upwards and in turn is cooled. A cold convection current is thus created.

Radiation

Radiation is the transfer of heat energy from a hot body to a cooler one by electromagnetic waves. Heat radiation is similar in character to light waves (see Chapter 19) — it travels at the same speed and can pass through a vacuum — except that the frequency of the waves are different. Waves are emitted by a hot body, are transmitted through space (even a vacuum) and are not detected until they fall on to another body. Radiation is reflected from shining, polished surfaces but absorbed by dull, black surfaces.

Practical applications of radiation include:

(i) heat from the sun reaching earth

(ii) heat felt by a flame

(iii) cooker grills

(iv) industrial furnaces

(v) infra-red space heaters
image

Vacuum Flask

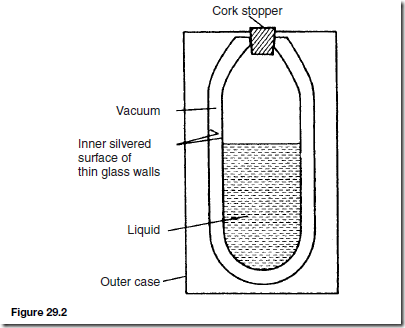
A cross-section of a typical vacuum flask is shown in Figure 29.2 and is seen to be a double-walled bottle with a vacuum space between them, the whole supported in a protective outer case.

Very little heat can be transferred by conduction because of the vacuum space and the cork stopper (cork is a bad conductor of heat). Also, because of the vacuum space, no convection is possible. Radiation is minimised by silvering the two glass surfaces (radiation is reflected off shining surfaces).

Thus a vacuum flask is an example of prevention of all three types of heat transfer and is therefore able to keep hot liquids hot and cold liquids cold.

Use of Insulation in Conserving Fuel

Fuel used for heating a building is becoming increasingly expensive. By the careful use of insulation, heat can be retained in a building for longer periods and the cost of heating thus minimised.

(i) Since convection causes hot air to rise it is important to insulate the roof space, which is probably the greatest source of heat loss in the home. This can be achieved by laying fibre-glass between the wooden joists in the roof space.

(ii) Glass is a poor conductor of heat. However, large losses can occur through thin panes of glass and such losses can be reduced by using double-glazing. Two sheets of glass, separated by air, are used. Air is a very good insulator but the air space must not be too large otherwise convection currents can occur which would carry heat across the space.

(iii) Hot water tanks should be lagged to prevent conduction and convection of heat to the surrounding air.

(iv) Brick, concrete, plaster and wood are all poor conductors of heat. A house is made from two walls with an air gap between them. Air is a poor conductor and trapped air minimises losses through the wall. Heat losses through the walls can be prevented almost completely by using cavity wall insulation, i.e. plastic-foam.

Besides changing temperature, the effects of supplying heat to a material can involve changes in dimensions, as well as in colour, state and electrical resistance.

Most substances expand when heated and contract when cooled, and there are many practical applications and design implications of thermal movement as explained in Chapter 30 following.


Heat Energy

Heat Energy

Introduction

Heat is a form of energy and is measured in joules.

Temperature is the degree of hotness or coldness of a substance. Heat and temperature are thus not the same thing. For example, twice the heat energy is needed to boil a full container of water than half a container — that is, different amounts of heat energy are needed to cause an equal rise in the temperature of different amounts of the same substance.

Temperature is measured either (i) on the Celsius (°C) scale (formerly Centigrade), where the temperature at which ice melts, i.e. the freezing point of water, is taken as 0°C and the point at which water boils under normal atmospheric pressure is taken as 100° C, or (ii) on the thermodynamic scale, in which the unit of temperature is the kelvin (K). The kelvin scale uses the same temperature interval as the Celsius scale but as its zero takes the ‘absolute zero of temperature’ which is at about Ð273° C. Hence,

image

The Measurement of Temperature

A thermometer is an instrument that measures temperature. Any substance that possesses one or more properties that vary with temperature can be used to measure temperature. These properties include changes in length, area or volume, electrical resistance or in colour. Examples of temperature measuring devices include:

(i) liquid-in-glass thermometer, which uses the expansion of a liquid with increase in temperature as its principle of operation

(ii) thermocouples, which use the e.m.f. set up when the junction of two

dissimilar metals is heated

(iii) resistance thermometer, which uses the change in electrical resistance caused by temperature change, and

(iv) pyrometers, which are devices for measuring very high temperatures, using the principle that all substances emit radiant energy when hot, the rate of emission depending on their temperature.

Each of these temperature measuring devices, together with others, are described in Chapter 31.

Specific Heat Capacity

The specific heat capacity of a substance is the quantity of heat energy required to raise the temperature of 1 kg of the substance by 1°C.

The symbol used for specific heat capacity is c and the units are J/(kg °C) or J/(kg K). (Note that these units may also be written as J kgÐ1 °CÐ1 or J kgÐ1 KÐ1)

Some typical values of specific heat capacity for the range of temperature 0°C to 100° C include:

image

Hence, to raise the temperature of 1 kg of iron by 1°C requires 500 J of energy, to raise the temperature of 5 kg of iron by 1°C requires (500 ð 5) J of energy, and to raise the temperature of 5 kg of iron by 40°C requires (500 ð 5 ð 40) J of energy, i.e. 100 kJ

In general, the quantity of heat energy, Q, required to raise a mass m kg of a substance with a specific heat capacity c J/(kg °C) from temperature t1°C

image

Change of State

A material may exist in any one of three states — solid, liquid or gas. If heat is supplied at a constant rate to some ice initially at, say, Ð30°C, its temperature rises as shown in Figure 29.1. Initially the temperature increases from Ð30°C to 0°C as shown by the line AB. It then remains constant at 0°C for the time BC required for the ice to melt into water.

When melting commences the energy gained by continual heating is offset by the energy required for the change of state and the temperature remains constant even though heating is continued. When the ice is completely melted to water, continual heating raises the temperature to 100°C, as shown by CD in Figure 29.1. The water then begins to boil and the temperature again remains constant at 100°C, shown as DE, until all the water has vaporised.

Continual heating raises the temperature of the steam as shown by EF in the region where the steam is termed superheated.

image

Changes of state from solid to liquid or liquid to gas occur without change of temperature and such changes are reversible processes. When heat energy flows to or from a substance and causes a change of temperature, such as between A and B, between C and D and between E and F in Figure 29.1, it is called sensible heat (since it can be ‘sensed’ by a thermometer).

Heat energy which flows to or from a substance while the temperature remains constant, such as between B and C and between D and E in Figure 29.1, is called latent heat (latent means concealed or hidden).

Latent Heats of Fusion and Vaporisation

The specific latent heat of fusion is the heat required to change 1 kg of a substance from the solid state to the liquid state (or vice versa) at constant temperature.

The specific latent heat of vaporisation is the heat required to change 1 kg of a substance from a liquid to a gaseous state (or vice versa) at constant temperature.

The units of the specific latent heats of fusion and vaporisation are J/kg, or more often kJ/kg, and some typical values are shown in Table 29.1

The quantity of heat Q supplied or given out during a change of state is given by:

Q = mL

where m is the mass in kilograms and L is the specific latent heat.

For example, the heat required to convert 10 kg of ice at 0°C to water at 0°C is given by 10 kg ð 335 kJ/kg D 3350 kJ or 3.35 MJ.

Besides changing temperature, the effects of supplying heat to a material can involve changes in dimensions, as well as in colour, state and electrical resistance. Most substances expand when heated and contract when cooled, and there are many practical applications and design implications of thermal movement (see Chapter 30).

image

Principle of Operation of a Simple Refrigerator

The boiling point of most liquids may be lowered if the pressure is lowered. In a simple refrigerator a working fluid, such as ammonia or freon, has the pressure acting on it reduced. The resulting lowering of the boiling point causes the liquid to vaporise. In vaporising, the liquid takes in the necessary latent heat from its surroundings, i.e. the freezer, which thus becomes cooled. The vapour is immediately removed by a pump to a condenser that is outside of the cabinet, where it is compressed and changed back into a liquid, giving out latent heat. The cycle is repeated when the liquid is pumped back to the freezer to be vaporised.

Conduction, Convection and Radiation

Heat may be transferred from a hot body to a cooler body by one or more of three methods, these being: (a) by conduction, (b) by convection, or (c) by radiation.

Conduction

Conduction is the transfer of heat energy from one part of a body to another (or from one body to another) without the particles of the body moving.

Conduction is associated with solids. For example, if one end of a metal bar is heated, the other end will become hot by conduction. Metals and metallic alloys are good conductors of heat, whereas air, wood, plastic, cork, glass and gases are examples of poor conductors (i.e. they are heat insulators).

Practical applications of conduction include:

(i) A domestic saucepan or dish conducts heat from the source to the contents.

Also, since wood and plastic are poor conductors of heat they are used for saucepan handles.

(ii) The metal of a radiator of a central heating system conducts heat from the hot water inside to the air outside.

Convection

Convection is the transfer of heat energy through a substance by the actual movement of the substance itself. Convection occurs in liquids and gases, but not in solids. When heated, a liquid or gas becomes less dense. It then rises and is replaced by a colder liquid or gas and the process repeats. For example, electric kettles and central heating radiators always heat up at the top first.

Examples of convection are:

(i) Natural circulation hot water heating systems depend on the hot water rising by convection to the top of the house and then falling back to the bottom of the house as it cools, releasing the heat energy to warm the house as it does so.

(ii) Convection currents cause air to move and therefore affect climate.

(iii) When a radiator heats the air around it, the hot air rises by convection and cold air moves in to take its place.

(iv) A cooling system in a car radiator relies on convection.

(v) Large electrical transformers dissipate waste heat to an oil tank. The heated oil rises by convection to the top, then sinks through cooling fins, losing heat as it does so.

(vi) In a refrigerator, the cooling unit is situated near the top. The air sur-

rounding the cold pipes become heavier as it contracts and sinks towards the bottom. Warmer, less dense air is pushed upwards and in turn is cooled. A cold convection current is thus created.

Radiation

Radiation is the transfer of heat energy from a hot body to a cooler one by electromagnetic waves. Heat radiation is similar in character to light waves (see Chapter 19) — it travels at the same speed and can pass through a vacuum — except that the frequency of the waves are different. Waves are emitted by a hot body, are transmitted through space (even a vacuum) and are not detected until they fall on to another body. Radiation is reflected from shining, polished surfaces but absorbed by dull, black surfaces.

Practical applications of radiation include:

(i) heat from the sun reaching earth

(ii) heat felt by a flame

(iii) cooker grills

(iv) industrial furnaces

(v) infra-red space heaters

image

Vacuum Flask

A cross-section of a typical vacuum flask is shown in Figure 29.2 and is seen to be a double-walled bottle with a vacuum space between them, the whole supported in a protective outer case.

Very little heat can be transferred by conduction because of the vacuum space and the cork stopper (cork is a bad conductor of heat). Also, because of the vacuum space, no convection is possible. Radiation is minimised by silvering the two glass surfaces (radiation is reflected off shining surfaces).

Thus a vacuum flask is an example of prevention of all three types of heat transfer and is therefore able to keep hot liquids hot and cold liquids cold.

Use of Insulation in Conserving Fuel

Fuel used for heating a building is becoming increasingly expensive. By the careful use of insulation, heat can be retained in a building for longer periods and the cost of heating thus minimised.

(i) Since convection causes hot air to rise it is important to insulate the roof space, which is probably the greatest source of heat loss in the home. This can be achieved by laying fibre-glass between the wooden joists in the roof space.

(ii) Glass is a poor conductor of heat. However, large losses can occur through thin panes of glass and such losses can be reduced by using double-glazing. Two sheets of glass, separated by air, are used. Air is a very good insulator but the air space must not be too large otherwise convection currents can occur which would carry heat across the space.

(iii) Hot water tanks should be lagged to prevent conduction and convection of heat to the surrounding air.

(iv) Brick, concrete, plaster and wood are all poor conductors of heat. A house is made from two walls with an air gap between them. Air is a poor conductor and trapped air minimises losses through the wall. Heat losses through the walls can be prevented almost completely by using cavity wall insulation, i.e. plastic-foam.

Besides changing temperature, the effects of supplying heat to a material can involve changes in dimensions, as well as in colour, state and electrical resistance.

Most substances expand when heated and contract when cooled, and there are many practical applications and design implications of thermal movement as explained in Chapter 30 following.


Linear Momentum,Impulse and Torque

Linear Momentum

The momentum of a body is defined as the product of its mass and its velocity, i.e. momentum = mu, where m D mass (in kg) and u D velocity (in m/s). The unit of momentum is kg m/s.

Since velocity is a vector quantity, momentum is a vector quantity, i.e.

it has both magnitude and direction.

For example, the momentum of a pile driver of mass 400 kg when it is moving downwards with a speed of 12 m/s is given by:

image

Newton’s first law of motion states:

a body continues in a state of rest or in a state of uniform motion in a straight line unless acted on by some external force

Hence the momentum of a body remains the same provided no external forces act on it.

The principle of conservation of momentum for a closed system (i.e. one on which no external forces act) may be stated as:

the total linear momentum of a system is a constant

The total momentum of a system before collision in a given direction is equal to the total momentum of the system after collision in the same direction. In Figure 27.1, masses m1 and m2 are travelling in the same direction with velocity u1 > u2 . A collision will occur, and applying the principle of conservation of momentum:

total momentum before impact D total momentum after impact

image

For example, a wagon of mass 10 t is moving at a speed of 6 m/s and collides with another wagon of mass 15 t, which is stationary. After impact, the wagons are coupled together. To determine the common velocity of the wagons after impact:

image

i.e. the common velocity after impact is 2.4 m/s in the direction in which the 10 t wagon is initially travelling.

Impulse and Impulsive Forces

Newton’s second law of motion states:

the rate of change of momentum is directly proportional to the applied force producing the change, and takes place in the direction of this force

In the SI system, the units are such that:

the applied force D rate of change of momentum

image

When a force is suddenly applied to a body due to either a collision with another body or being hit by an object such as a hammer, the time taken in equation (1) is very small and difficult to measure. In such cases, the total effect of the force is measured by the change of momentum it produces.

Forces that act for very short periods of time are called impulsive forces. The product of the impulsive force and the time during which it acts is called

the impulse of the force and is equal to the change of momentum produced by the impulsive force, i.e.

impulse = applied force × time = change in linear momentum

For example, the average force exerted on the work-piece of a press-tool operation is 150 kN, and the tool is in contact with the work-piece for 50 ms.

From above,

image

Examples where impulsive forces occur include when a gun recoils and when a free-falling mass hits the ground. Solving problems associated with such occurrences often requires the use of the equation of motion: v2 D u2 C 2as, from Chapter 15.

For example, the hammer of a pile-driver of mass 1 t falls a distance of 1.5 m on to a pile. The blow takes place in 25 ms and the hammer does not rebound.

image

Since the impulsive force is the rate of change of momentum, the average force exerted on the pile is 217 kN

When a pile is being hammered into the ground, the ground resists the movement of the pile and this resistance is called a resistive force.

Newton’s third law of motion may be stated as:

for every force there is an equal and opposite force

The force applied to the pile is the resistive force; the pile exerts an equal and opposite force on the ground.

In practice, when impulsive forces occur, energy is not entirely conserved and some energy is changed into heat, noise, and so on.

 Torque

Couple and Torque

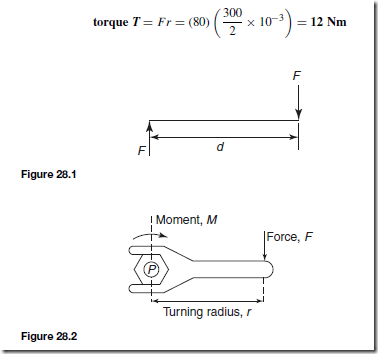
When two equal forces act on a body as shown in Figure 28.1, they cause the body to rotate, and the system of forces is called a couple.

The turning moment of a couple is called a torque, T. In Figure 28.1,

image

The unit of torque is the newton metre, Nm

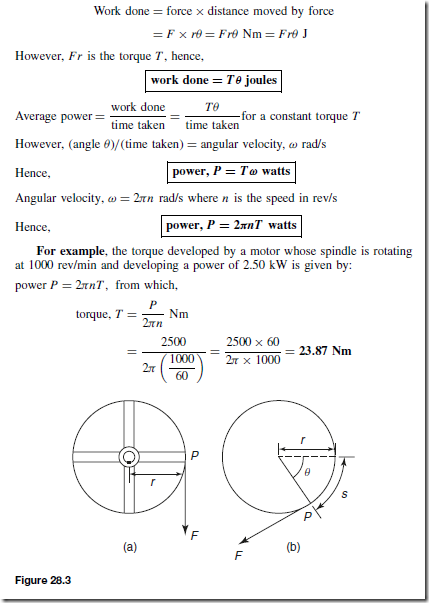
When a force F newtons is applied at a radius r metres from the axis of, say, a nut to be turned by a spanner, as shown in Figure 28.2, the torque T applied to the nut is given by: T = Fr Nm

For example, the torque when a pulley wheel of diameter 300 mm has a force of 80 N applied at the rim, is given by:

image

Work Done and Power Transmitted by a Constant Torque

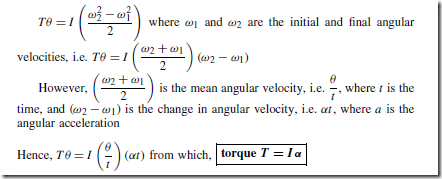
Figure 28.3(a) shows a pulley wheel of radius r metres attached to a shaft and a force F newtons applied to the rim at point P

Figure 28.3(b) shows the pulley wheel having turned through an angle (} radians as a result of the force F being applied. The force moves through a distance s, where arc length

image

From above, work done D T(}, and if this work is available to increase the kinetic energy of a rotating body of moment of inertia I, then:

image

where I is the moment of inertia in kg m2, ˛ is the angular acceleration in rad/s2 and T is the torque in Nm.

For example, if a shaft system has a moment of inertia of 37.5 kg m2, the torque required to give it an angular acceleration of 5.0 rad/s2 is given by:

image

Power Transmission by Belt Drives

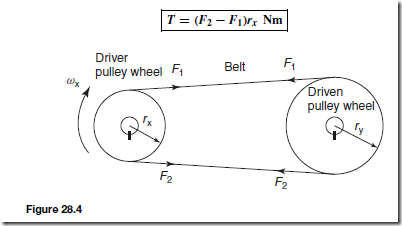
A common and simple method of transmitting power from one shaft to another is by means of a belt passing over pulley wheels which are keyed to the shafts, as shown in Figure 28.4. Typical applications include an electric motor driving a lathe or a drill, and an engine driving a pump or generator.

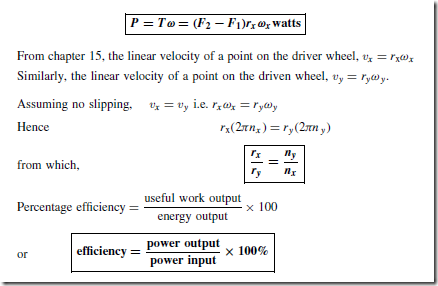
For a belt to transmit power between two pulleys there must be a difference in tensions in the belt on either side of the driving and driven pulleys. For the direction of rotation shown in Figure 28.4, F2 > F1

The torque T available at the driving wheel to do work is given by:

image

and the available power P is given by:

image

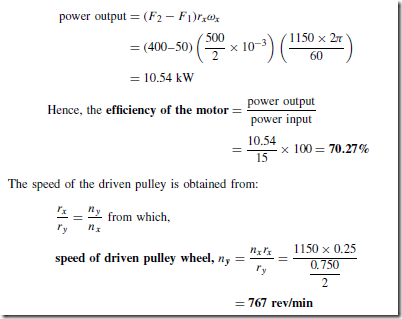
For example, a 15 kW motor is driving a shaft at 1150 rev/min by means of pulley wheels and a belt. The tensions in the belt on each side of the driver pulley wheel are 400 N and 50 N. The diameters of the driver and driven pulley wheels are 500 mm and 750 mm respectively. The power output from the motor is given by:

image

Flat and V-belts

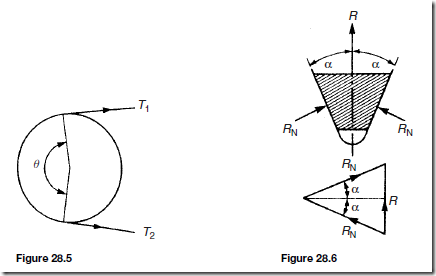
The ratio of the tensions for a flat belt when the belt is on the point of slipping is: image

where 11 is the coefficient of friction between belt and pulley, (} is the angle of lap, in radians (see Figure 28.5), and e is the exponent ³ 2.718

For a vee belt as in Figure 28.6, the ratio is:image

where ˛ is the half angle of the groove and of the belt.

This gives a much larger ratio than for the flat belt. The V-belt is jammed into its groove and is less likely to slip. Referring to Figure 28.6, the force of friction on each side is 11RN where RN is the normal (perpendicular) reaction

on each side. The triangle of forces shows that image where R is the resultant reaction. The force of friction giving rise to the difference between T1 and T2 is therefore  image

The corresponding force of friction for a flat belt is 11R. Comparing the forces of friction for flat and V-belts it can be said that the V-belt is equivalent to a flat belt with a coefficient of friction given by image

The net force exerted on the belt by a driving pulley, or the belt on a driven pulley is T1 Ł T2. The power transmitted by a belt is therefore (T1 Ł T2)v, where v is the speed of the belt. If (T1 Ł T2) is measured in newtons and v in metres per second, the power will be Nm/s, i.e. watts (W).

image

The belt speed is given in m/s by ωr, where ω is the angular speed of the pulley (rad/s) and r is its radius (m).

image where N is the pulley speed in rev/min. 60

It should be noted that:

(a) slipping would be expected to occur first on the pulley having the smaller angle of lap

(b) in practice, care would be taken to ensure that slipping is not likely to

occur.

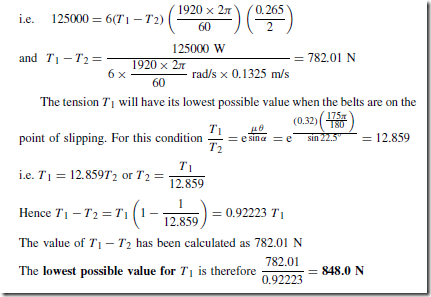
For example, a pulley has vee grooves to take six belts which are required to transmit 125 kW from the pulley when its speed is 1920 rev/min. The angle of the grooves is 45° , the angle of lap is 175° and the effective diameter of the pulley is 265 mm. If the coefficient of friction is 0.32, the lowest possible value for the tension on the tight side of each belt is calculated as follows:

The power transmitted by the six belts is given by: 6(T1 Ł T2)v where T1 and T2 are the tensions on the tight and slack sides respectively of one belt, and v (D ωr) is the belt speed,

image


Measurement of Strain

Measurement of Strain

Introduction

An essential requirement of engineering design is the accurate determination of stresses and strains in components under working conditions. ‘Strength of materials’ is a subject relating to the physical nature of substances which are acted upon by external forces. No solid body is perfectly rigid, and when forces are applied to it changes in dimensions occur. Such changes are not always perceptible to the human eye since they are so small. For example, a spanner will bend slightly when tightening a nut, and the span of a bridge will sag under the weight of a car.

Strain

The change in the value of a linear dimension of a body, say x, divided by the original value of the dimension, say l, gives a great deal of information about what is happening to the material itself. This ratio is called strain, ε, and is dimensionless, i.e. ε =x/i

Stress

The force (F) acting on an area (A) of a body is called the stress, a, and is measured in pascals (Pa) or newtons per square metre (N/m2), i.e. image

Young’s Modulus of Elasticity

If a solid body is subjected to a gradually increasing stress, and if both the stress and the resulting strain are measured, a graph of stress against strain may be drawn. Up to a certain value of stress the graph is a straight line. That particular value is known as the limit of proportionality and its value varies for different materials. The gradient of the straight line is a constant known as Young’s modulus of elasticity, E

image

Young’s modulus of elasticity is a constant for a given material. As an example, mild steel has a value of E of about 210 ð 109 Pa (i.e. 210 GPa).

Elastic Limit

If on removal of external forces a body recovers its original shape and size, the material is said to be elastic. If it does not return to its original shape, it is said to be plastic. Copper, steel and rubber are examples of elastic materials while lead and plasticine are plastic materials. However, even for elastic materials there is a limit to the amount of strain from which it can recover its original dimensions. This limit is called the elastic limit of the material. The elastic limit and the limit of proportionality for all engineering materials are virtually the same. If a body is strained beyond the elastic limit permanent deformation will occur.

The Need for Strain Measurement

In designing a structure, such as an electricity transmission tower carrying overhead power lines or support pillars and spans of new designs of bridges, the engineer is greatly concerned about the mechanical properties of the materials he is going to use. Many laboratory tests have been designed to provide important information about materials. Such tests include tensile, compression, torsion, impact, creep and fatigue tests and each attempt to provide information about the behaviour of materials under working conditions. (A typical tensile test is described in Chapter 24)

It is possible to design a structure that is strong enough to withstand the forces encountered in service, but is, nonetheless, useless because of the amount of elastic deformation. Hence, tests made on materials up to the elastic limit are of great importance. A material that has a relatively high value of Young’s modulus is said to have a high value of stiffness, stiffness being the

image

Thus, when the determination of Young’s modulus of elasticity, E, of a material is required, an accurate stress/strain or load/extension graph must be obtained. The actual strain is very small and this means that very small extensions must be measured with a high degree of accuracy.

The measurement of extension, and thus strain, is achieved in the laboratory with an instrument called an extensometer. Although some extensometers can be used in such practical situations as a crane under load, it is more usual to use in these situations an electrical device called a strain gauge.

A knowledge of stress and strain is the foundation of economy and safety in design.

Extensometers

An extensometer is an instrument used in engineering and metallurgical design to measure accurately the minute elastic extensions of materials, in order to forecast their behaviour during use. There are several different designs of extensometer including the Lindley, the Huggenburger and the Hounsfield.

The Lindley extensometer

This is probably the most common type of extensometer used for measuring tensile strains. This instrument consists of two arms, A and B, connected by a strip of spring steel that acts as a hinge. The unstressed specimen of the material is clamped at points C and D by pointed screws, the distance between C and D usually being 50 mm. Thus 50 mm is termed the ‘gauge length’. A dial test indicator is placed between the arms A and B as shown in the typical arrangement of the Lindley extensometer in Figure 26.1

The point D is halfway between the hinge and the indicator; hence the movement of the pointer on the test indicator will record twice the extension

of the specimen. However, the indicator is normally calibrated so that it indi- cates extension directly, each graduation representing an extension of 1 micron

(i.e. 10Ł6 m or 0.001 mm). Extensions may be measured to an accuracy of 0.0001 mm using the Lindley extensometer.

image

The Huggenburger extensometer

This is a simple, rugged and accurate instrument that may be used to measure tensile or compressive strains. Its construction is based on a lever multiplying system capable of obtaining magnifications in the order of 2000. Figure 26.2 shows a simplified schematic arrangement of a front view of the Huggenburger

image

extensometer clamped to a specimen, where Q and R are two knife-edges, usually either 0 mm or 20 mm apart. Any strain encountered by the specimen under test will alter the gauge length QR. In Figure 26.2, the specimen is shown in tension, thus QR will increase in length. This change is transmitted by pivots (labelled P) and levers S and T to the pointer, and is indicated on the scale according to the multiplication factor. The supplier who calibrates each device after manufacture supplies this factor, of approximately 2000, to the instrument user. This type of extensometer enables extensions to be recorded to an accuracy comparable with the Lindley extensometer and may be used in the laboratory or in the field.

The Hounsfield extensometer

This may be used in conjunction with a Hounsfield Tensometer (which is a universal portable testing machine capable of applying tensile or compressive forces to metals, plastics, textiles, timber, paper and so on), or with any other testing machine. The extensometer is a precision instrument for measuring the extension of a test specimen over a 50 mm gauge length, while the test specimen is loaded in the testing machine. The instrument can be attached to round specimens of material of up to 25 mm in diameter or rectangular sections of material of up to 25 mm square at precisely 50 mm gauge length without prior marking of the specimen. Figure 26.3 shows a typical Hounsfield extensometer viewed from two different elevations.

The gauge length rod is screwed into position, making the fixed centres exactly 50 mm apart. The extensometer is then clamped to the test piece before the gauge length rod is unscrewed. With the test piece still unloaded the micrometer is wound in until the platinum contacts meet, thus completing the circuit (shown by the lamp lighting up). The micrometer reading is then taken and the micrometer head unwound. After the load is placed on the

image

specimen the micrometer head is again wound in and a new reading taken when the lamp lights. The difference between the two micrometer readings is an indication of the extension of the test piece for the particular load applied. Each division of the micrometer wheel is equal to 0.002 mm. The accuracy of the Hounsfield extensometer compares favourably with other extensometers, and an advantage, in certain circumstances, of this instrument is its small overall size.

Strain Gauges

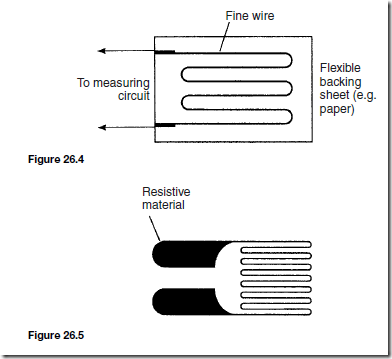
A strain gauge is an electrical device used for measuring mechanical strain, i.e. the change in length accompanying the application of a stress. The strain gauge consists essentially of a very fine piece of wire that is cemented, or glued strongly, to the part where the strain is to be measured. When the length of a piece of wire is changed, a change in its electrical resistance occurs, this change in resistance being proportional to the change in length of the wire. Thus, when the wire is securely cemented to the part that is being strained, a change of electrical resistance of the wire occurs due to the change in length. By measuring this change of resistance the strain can be determined. The strain gauge was first introduced in the USA in 1939 and since that time it has come into widespread use, particularly in the aircraft industry, and is now the basis of one of the most useful of stress analysis techniques. A typical simple strain gauge is shown in Figure 26.4.

Rolling out a thin foil of the resistive material, and then cutting away parts of the foil by a photo-etching process to create the required grid pattern form a modern strain gauge. Such a device is called a foil strain gauge and a typical arrangement is shown in Figure 26.5. A foil-strain gauge has many advantages over the earlier method and these include:

(i) better adhesion between conductor and backing material,

(ii) better heat dissipation,

(iii) a more robust construction,

(iv) easier to attach leads to,

(v) accurate reproducibility of readings, and

(vi) smaller sizes are possible.

In order to obtain a deflection on a galvanometer, G, proportional to the strain occurring in the gauge, it must be connected into one arm of a Wheatstone

image

image

bridge, as shown in Figure 26.6. A Wheatstone bridge circuit having four equal resistances in the arms has zero deflection on the galvanometer, but when the resistance of one or more of the arms changes, then the bridge galvanometer deflects from zero, the amount of deflection being a measure of the change in resistance. If the resistance change occurs in a strain gauge as a result of applied strain, then the bridge galvanometer deflection is a measure of the amount of strain. For very accurate measurements of strain there are a number of possible sophistications. These are not described in detail in this chapter but include:

(i) the use of a temperature-compensating dummy gauge to make the bridge output independent of temperature, since the resistance of a gauge varies with temperature and such a resistance change may be misread as strain in the material,

(ii) an additional bridge balancing circuit to obtain zero galvanometer deflection for zero strain, and

(iii) the addition of an amplifier to amplify the signal output from the bridge in applications where the level of strain is such that the bridge deflection is too small to readily detect on a galvanometer.

A typical selection of practical situations where strain gauges are used include:

(i) the airframe and skin of an aircraft in flight,

(ii) electricity pylons, cranes and support pillars and spans of new designs of bridges, where strain must be tested to validate the design, and

(iii) applications in harsh environments and remote positions, such as inside

nuclear boilers, on turbine blades, in vehicle engines, on helicopter blades in flight and under water on oil rig platforms, where a knowledge of strain is required.


Measurement of Strain

Measurement of Strain

Introduction

An essential requirement of engineering design is the accurate determination of stresses and strains in components under working conditions. ‘Strength of materials’ is a subject relating to the physical nature of substances which are acted upon by external forces. No solid body is perfectly rigid, and when forces are applied to it changes in dimensions occur. Such changes are not always perceptible to the human eye since they are so small. For example, a spanner will bend slightly when tightening a nut, and the span of a bridge will sag under the weight of a car.

Strain

The change in the value of a linear dimension of a body, say x, divided by the original value of the dimension, say l, gives a great deal of information about what is happening to the material itself. This ratio is called strain, ε, and is dimensionless, i.e. ε =x/i

Stress

The force (F) acting on an area (A) of a body is called the stress, a, and is measured in pascals (Pa) or newtons per square metre (N/m2), i.e. image

Young’s Modulus of Elasticity

If a solid body is subjected to a gradually increasing stress, and if both the stress and the resulting strain are measured, a graph of stress against strain may be drawn. Up to a certain value of stress the graph is a straight line. That particular value is known as the limit of proportionality and its value varies for different materials. The gradient of the straight line is a constant known as Young’s modulus of elasticity, E

image

Young’s modulus of elasticity is a constant for a given material. As an example, mild steel has a value of E of about 210 ð 109 Pa (i.e. 210 GPa).

Elastic Limit

If on removal of external forces a body recovers its original shape and size, the material is said to be elastic. If it does not return to its original shape, it is said to be plastic. Copper, steel and rubber are examples of elastic materials while lead and plasticine are plastic materials. However, even for elastic materials there is a limit to the amount of strain from which it can recover its original dimensions. This limit is called the elastic limit of the material. The elastic limit and the limit of proportionality for all engineering materials are virtually the same. If a body is strained beyond the elastic limit permanent deformation will occur.

The Need for Strain Measurement

In designing a structure, such as an electricity transmission tower carrying overhead power lines or support pillars and spans of new designs of bridges, the engineer is greatly concerned about the mechanical properties of the materials he is going to use. Many laboratory tests have been designed to provide important information about materials. Such tests include tensile, compression, torsion, impact, creep and fatigue tests and each attempt to provide information about the behaviour of materials under working conditions. (A typical tensile test is described in Chapter 24)

It is possible to design a structure that is strong enough to withstand the forces encountered in service, but is, nonetheless, useless because of the amount of elastic deformation. Hence, tests made on materials up to the elastic limit are of great importance. A material that has a relatively high value of Young’s modulus is said to have a high value of stiffness, stiffness being the

image

Thus, when the determination of Young’s modulus of elasticity, E, of a material is required, an accurate stress/strain or load/extension graph must be obtained. The actual strain is very small and this means that very small extensions must be measured with a high degree of accuracy.

The measurement of extension, and thus strain, is achieved in the laboratory with an instrument called an extensometer. Although some extensometers can be used in such practical situations as a crane under load, it is more usual to use in these situations an electrical device called a strain gauge.

A knowledge of stress and strain is the foundation of economy and safety in design.

Extensometers

An extensometer is an instrument used in engineering and metallurgical design to measure accurately the minute elastic extensions of materials, in order to forecast their behaviour during use. There are several different designs of extensometer including the Lindley, the Huggenburger and the Hounsfield.

The Lindley extensometer

This is probably the most common type of extensometer used for measuring tensile strains. This instrument consists of two arms, A and B, connected by a strip of spring steel that acts as a hinge. The unstressed specimen of the material is clamped at points C and D by pointed screws, the distance between C and D usually being 50 mm. Thus 50 mm is termed the ‘gauge length’. A dial test indicator is placed between the arms A and B as shown in the typical arrangement of the Lindley extensometer in Figure 26.1

The point D is halfway between the hinge and the indicator; hence the movement of the pointer on the test indicator will record twice the extension

of the specimen. However, the indicator is normally calibrated so that it indi- cates extension directly, each graduation representing an extension of 1 micron

(i.e. 10Ł6 m or 0.001 mm). Extensions may be measured to an accuracy of 0.0001 mm using the Lindley extensometer.

image

The Huggenburger extensometer

This is a simple, rugged and accurate instrument that may be used to measure tensile or compressive strains. Its construction is based on a lever multiplying system capable of obtaining magnifications in the order of 2000. Figure 26.2 shows a simplified schematic arrangement of a front view of the Huggenburger

image

extensometer clamped to a specimen, where Q and R are two knife-edges, usually either 0 mm or 20 mm apart. Any strain encountered by the specimen under test will alter the gauge length QR. In Figure 26.2, the specimen is shown in tension, thus QR will increase in length. This change is transmitted by pivots (labelled P) and levers S and T to the pointer, and is indicated on the scale according to the multiplication factor. The supplier who calibrates each device after manufacture supplies this factor, of approximately 2000, to the instrument user. This type of extensometer enables extensions to be recorded to an accuracy comparable with the Lindley extensometer and may be used in the laboratory or in the field.

The Hounsfield extensometer

This may be used in conjunction with a Hounsfield Tensometer (which is a universal portable testing machine capable of applying tensile or compressive forces to metals, plastics, textiles, timber, paper and so on), or with any other testing machine. The extensometer is a precision instrument for measuring the extension of a test specimen over a 50 mm gauge length, while the test specimen is loaded in the testing machine. The instrument can be attached to round specimens of material of up to 25 mm in diameter or rectangular sections of material of up to 25 mm square at precisely 50 mm gauge length without prior marking of the specimen. Figure 26.3 shows a typical Hounsfield extensometer viewed from two different elevations.

The gauge length rod is screwed into position, making the fixed centres exactly 50 mm apart. The extensometer is then clamped to the test piece before the gauge length rod is unscrewed. With the test piece still unloaded the micrometer is wound in until the platinum contacts meet, thus completing the circuit (shown by the lamp lighting up). The micrometer reading is then taken and the micrometer head unwound. After the load is placed on the

image

specimen the micrometer head is again wound in and a new reading taken when the lamp lights. The difference between the two micrometer readings is an indication of the extension of the test piece for the particular load applied. Each division of the micrometer wheel is equal to 0.002 mm. The accuracy of the Hounsfield extensometer compares favourably with other extensometers, and an advantage, in certain circumstances, of this instrument is its small overall size.

Strain Gauges

A strain gauge is an electrical device used for measuring mechanical strain, i.e. the change in length accompanying the application of a stress. The strain gauge consists essentially of a very fine piece of wire that is cemented, or glued strongly, to the part where the strain is to be measured. When the length of a piece of wire is changed, a change in its electrical resistance occurs, this change in resistance being proportional to the change in length of the wire. Thus, when the wire is securely cemented to the part that is being strained, a change of electrical resistance of the wire occurs due to the change in length. By measuring this change of resistance the strain can be determined. The strain gauge was first introduced in the USA in 1939 and since that time it has come into widespread use, particularly in the aircraft industry, and is now the basis of one of the most useful of stress analysis techniques. A typical simple strain gauge is shown in Figure 26.4.

Rolling out a thin foil of the resistive material, and then cutting away parts of the foil by a photo-etching process to create the required grid pattern form a modern strain gauge. Such a device is called a foil strain gauge and a typical arrangement is shown in Figure 26.5. A foil-strain gauge has many advantages over the earlier method and these include:

(i) better adhesion between conductor and backing material,

(ii) better heat dissipation,

(iii) a more robust construction,

(iv) easier to attach leads to,

(v) accurate reproducibility of readings, and

(vi) smaller sizes are possible.

In order to obtain a deflection on a galvanometer, G, proportional to the strain occurring in the gauge, it must be connected into one arm of a Wheatstone

image

image

bridge, as shown in Figure 26.6. A Wheatstone bridge circuit having four equal resistances in the arms has zero deflection on the galvanometer, but when the resistance of one or more of the arms changes, then the bridge galvanometer deflects from zero, the amount of deflection being a measure of the change in resistance. If the resistance change occurs in a strain gauge as a result of applied strain, then the bridge galvanometer deflection is a measure of the amount of strain. For very accurate measurements of strain there are a number of possible sophistications. These are not described in detail in this chapter but include:

(i) the use of a temperature-compensating dummy gauge to make the bridge output independent of temperature, since the resistance of a gauge varies with temperature and such a resistance change may be misread as strain in the material,

(ii) an additional bridge balancing circuit to obtain zero galvanometer deflection for zero strain, and

(iii) the addition of an amplifier to amplify the signal output from the bridge in applications where the level of strain is such that the bridge deflection is too small to readily detect on a galvanometer.

A typical selection of practical situations where strain gauges are used include:

(i) the airframe and skin of an aircraft in flight,

(ii) electricity pylons, cranes and support pillars and spans of new designs of bridges, where strain must be tested to validate the design, and

(iii) applications in harsh environments and remote positions, such as inside

nuclear boilers, on turbine blades, in vehicle engines, on helicopter blades in flight and under water on oil rig platforms, where a knowledge of strain is required.


Hardness and Impact Tests.

Hardness and Impact Tests

Hardness

The hardness of a material may be defined in the following ways:

(i) the ability to scratch other materials

(ii) the ability to resist scratching

(iii) the ability to resist plastic spreading under indentation

(iv) the ability to resist elastic deformation under indentation

(v) the ability to resist deformation by rolling

Hardness Tests

Hardness tests are based on pressing a hard substance, such as a diamond or a steel sphere having known dimensions, into the material under test. The hardness can be determined from the size of indentation made for a known load. The three principal hardness tests are:

(a) the Brinell test,

(b) the Vickers test, and

(c) the Rockwell test.

The Brinell Test

In a standard Brinell test, a hardened steel ball having a diameter of 10 mm is squeezed into the material under a load of 3000 kg. The diameter of the indentation produced is measured under a microscope. The Brinell hardness number, HB , is given by:

image

Variations on the standard test include smaller loads used for soft materials, balls of different diameters (usually restricted to 1, 2 and 5 mm) and the steel ball being replaced by one made of tungsten carbide for use with very hard materials. Values of Brinell hardness number vary from about 900 for very hard materials having an equivalent tensile strength for steel of 3000 MPa,

down to about 100 for materials having an equivalent tensile strength for steel of about 350 MPa.

The following precautions are required when carrying out a Brinell test.

(i) The material must be sufficiently wide and thick. The impression must have its centre not less than two and a half times its diameter from any edge. The thickness must be at least ten times the depth of the impression, this depth being given by:image Brinell hardness number.

(ii) The surface of the material should, if possible, be ground flat and polished.

(iii) The load should be held for 5 s.

(iv) Two diameters of the impression at right angles should be read and their mean used in the calculation.

(v) When stating the result of the test the ball number and load should be stated; for example, H10/3000 D 410

Special machines are made but a Brinell test can be carried out on most universal testing machines.

For materials of the same quality and for families of materials an approx- imate direct proportional relationship seems to exist between tensile strength and Brinell hardness number. For example, a nickel-chrome steel which is hardened and then tempered to various temperatures has tensile strengths

varying from 1900 MPa to 1070 MPa as the Brinell hardness number varies

clip_image006from 530 to 300. A constant of proportionality k for: tensile strength D (k ð hardness) in this case is 3.57 for all tempering temperatures. Similarly, for a family of carbon steels, the tensile strength varies from 380 MPa to 790 MPa as the carbon content increases. The Brinell hardness number varies from 115 to 230 over the same range of carbon values and the constant of proportionality in this case is 3.35. Because of the general approximate relationship between tensile strength and hardness, tables exist relating these quantities, the tables usually based on a constant of proportionality of about 3.35.

Vickers Test

In a Vickers diamond pyramid hardness test, a square-based diamond pyramid is pressed into the material under test. The angle between opposite faces of the diamond is 136° and the load applied is one of the values 5, 10, 30, 50 or 120 kg, depending on the hardness of the material. The Vickers diamond hardness number, HV , is given by:

image

where F is the load in kilograms and d is the length of the diagonal of the square of indentation in millimetres.

The Rockwell Test

The Rockwell hardness test is mainly used for rapid routine testing of finished material, the hardness number being indicated directly on a dial. The value of hardness is based directly on the depth of indentation of either a steel ball or a cone shaped diamond with a spherically rounded tip, called a ‘brale’. Whether the steel ball or brale is selected for use depends on the hardness of the material under test, the steel ball being used for materials having a hardness up to that of medium carbon steels.

Several different scales are shown on the dial, and can include Rockwell A to H scales together with Rockwell K, N and T scales. Examples of the scale used are:

Scale A: using a brale and a 60 kg load Scale B: using a brale and a 150 kg load

Scale C: using a 1/16th inch steel ball and 100 kg load, and so on.

The big advantage of the Rockwell test over Brinell and Vickers tests is the speed with which it can be made. As it is also independent of surface condition it is well suited to production line testing. British Standards, however, require hardness numbers to be based on the surface area of any indentation.

Other Hardness Tests

The Brinell, Vickers and Rockwell tests are examples of static hardness tests. Another example is the Firth Hardometer test, which is very similar to the Vickers test.

Examples of dynamic hardness tests are those using the Herbert pendulum Hardness Tester and the Shore Scleroscope. The former uses an arched rocker resting on a steel or diamond pivot; hardness can be indicated by the time taken for ten swings or by the difference between an initial angular displacement and the first swing. The Scleroscope is a portable apparatus in which a diamond-tipped hammer falls on to the material under test. The height of the rebound gives the hardness number.

Other Non-destructive Tests

Flaws inside a casting can be revealed by X-ray methods. Surface flaws can be revealed by electro-magnetic methods and by those using ultra-violet light. The former are applicable only to ferrous metals but the latter can be used for other metals and for other materials, such as plastics and ceramics.

Impact Tests

To give an indication of the toughness of a material, that is, the energy needed to fracture it, impact tests are carried out. Two such tests are the Izod test,

principally used in Great Britain, and the Charpy test that is widely used in other parts of Europe.

Izod Test

In an Izod test, a square test piece of side 10 mm and having a vee-notch of angle 45° machined along one side, is clamped firmly in a vice in the base of the Izod test machine. A heavy pendulum swings down to strike the specimen and fractures it. The difference between the release angle of the pendulum measured to the vertical and the overswing angle after fracturing the specimen is proportional to the energy expended in fracturing the specimen, and can be read from a scale on the testing machine. An Izod test is basically an acceptance test, that is, the value of impact energy absorbed is either acceptable or is not acceptable. The results of an Izod test cannot be used to determine impact strength under other conditions.

Charpy Test

A Charpy test is similar to an Izod test, the only difference being the method of mounting the test specimen and a capability of varying the mass of the pendulum. In the Izod test, the specimen is gripped at one end and is supported as a cantilever, compared with the specimen being supported at each end as a beam in the Charpy test. One other difference is that the notch is at the centre of the supported beam and faces away from the striker.


Hardness and Impact Tests.

Hardness and Impact Tests

Hardness

The hardness of a material may be defined in the following ways:

(i) the ability to scratch other materials

(ii) the ability to resist scratching

(iii) the ability to resist plastic spreading under indentation

(iv) the ability to resist elastic deformation under indentation

(v) the ability to resist deformation by rolling

Hardness Tests

Hardness tests are based on pressing a hard substance, such as a diamond or a steel sphere having known dimensions, into the material under test. The hardness can be determined from the size of indentation made for a known load. The three principal hardness tests are:

(a) the Brinell test,

(b) the Vickers test, and

(c) the Rockwell test.

The Brinell Test

In a standard Brinell test, a hardened steel ball having a diameter of 10 mm is squeezed into the material under a load of 3000 kg. The diameter of the indentation produced is measured under a microscope. The Brinell hardness number, HB , is given by:

image

Variations on the standard test include smaller loads used for soft materials, balls of different diameters (usually restricted to 1, 2 and 5 mm) and the steel ball being replaced by one made of tungsten carbide for use with very hard materials. Values of Brinell hardness number vary from about 900 for very hard materials having an equivalent tensile strength for steel of 3000 MPa,

down to about 100 for materials having an equivalent tensile strength for steel of about 350 MPa.

The following precautions are required when carrying out a Brinell test.

(i) The material must be sufficiently wide and thick. The impression must have its centre not less than two and a half times its diameter from any edge. The thickness must be at least ten times the depth of the impression, this depth being given by:image Brinell hardness number.

(ii) The surface of the material should, if possible, be ground flat and polished.

(iii) The load should be held for 5 s.

(iv) Two diameters of the impression at right angles should be read and their mean used in the calculation.

(v) When stating the result of the test the ball number and load should be stated; for example, H10/3000 D 410

Special machines are made but a Brinell test can be carried out on most universal testing machines.

For materials of the same quality and for families of materials an approx- imate direct proportional relationship seems to exist between tensile strength and Brinell hardness number. For example, a nickel-chrome steel which is hardened and then tempered to various temperatures has tensile strengths

varying from 1900 MPa to 1070 MPa as the Brinell hardness number varies

clip_image006from 530 to 300. A constant of proportionality k for: tensile strength D (k ð hardness) in this case is 3.57 for all tempering temperatures. Similarly, for a family of carbon steels, the tensile strength varies from 380 MPa to 790 MPa as the carbon content increases. The Brinell hardness number varies from 115 to 230 over the same range of carbon values and the constant of proportionality in this case is 3.35. Because of the general approximate relationship between tensile strength and hardness, tables exist relating these quantities, the tables usually based on a constant of proportionality of about 3.35.

Vickers Test

In a Vickers diamond pyramid hardness test, a square-based diamond pyramid is pressed into the material under test. The angle between opposite faces of the diamond is 136° and the load applied is one of the values 5, 10, 30, 50 or 120 kg, depending on the hardness of the material. The Vickers diamond hardness number, HV , is given by:

image

where F is the load in kilograms and d is the length of the diagonal of the square of indentation in millimetres.

The Rockwell Test

The Rockwell hardness test is mainly used for rapid routine testing of finished material, the hardness number being indicated directly on a dial. The value of hardness is based directly on the depth of indentation of either a steel ball or a cone shaped diamond with a spherically rounded tip, called a ‘brale’. Whether the steel ball or brale is selected for use depends on the hardness of the material under test, the steel ball being used for materials having a hardness up to that of medium carbon steels.

Several different scales are shown on the dial, and can include Rockwell A to H scales together with Rockwell K, N and T scales. Examples of the scale used are:

Scale A: using a brale and a 60 kg load Scale B: using a brale and a 150 kg load

Scale C: using a 1/16th inch steel ball and 100 kg load, and so on.

The big advantage of the Rockwell test over Brinell and Vickers tests is the speed with which it can be made. As it is also independent of surface condition it is well suited to production line testing. British Standards, however, require hardness numbers to be based on the surface area of any indentation.

Other Hardness Tests

The Brinell, Vickers and Rockwell tests are examples of static hardness tests. Another example is the Firth Hardometer test, which is very similar to the Vickers test.

Examples of dynamic hardness tests are those using the Herbert pendulum Hardness Tester and the Shore Scleroscope. The former uses an arched rocker resting on a steel or diamond pivot; hardness can be indicated by the time taken for ten swings or by the difference between an initial angular displacement and the first swing. The Scleroscope is a portable apparatus in which a diamond-tipped hammer falls on to the material under test. The height of the rebound gives the hardness number.

Other Non-destructive Tests

Flaws inside a casting can be revealed by X-ray methods. Surface flaws can be revealed by electro-magnetic methods and by those using ultra-violet light. The former are applicable only to ferrous metals but the latter can be used for other metals and for other materials, such as plastics and ceramics.

Impact Tests

To give an indication of the toughness of a material, that is, the energy needed to fracture it, impact tests are carried out. Two such tests are the Izod test,

principally used in Great Britain, and the Charpy test that is widely used in other parts of Europe.

Izod Test

In an Izod test, a square test piece of side 10 mm and having a vee-notch of angle 45° machined along one side, is clamped firmly in a vice in the base of the Izod test machine. A heavy pendulum swings down to strike the specimen and fractures it. The difference between the release angle of the pendulum measured to the vertical and the overswing angle after fracturing the specimen is proportional to the energy expended in fracturing the specimen, and can be read from a scale on the testing machine. An Izod test is basically an acceptance test, that is, the value of impact energy absorbed is either acceptable or is not acceptable. The results of an Izod test cannot be used to determine impact strength under other conditions.

Charpy Test

A Charpy test is similar to an Izod test, the only difference being the method of mounting the test specimen and a capability of varying the mass of the pendulum. In the Izod test, the specimen is gripped at one end and is supported as a cantilever, compared with the specimen being supported at each end as a beam in the Charpy test. One other difference is that the notch is at the centre of the supported beam and faces away from the striker.


Tensile Testing

Tensile Testing

The Tensile Test

A tensile test is one in which a force is applied to a specimen of a material in increments and the corresponding extension of the specimen noted. The process may be continued until the specimen breaks into two parts and this is called testing to destruction. The testing is usually carried out using a universal testing machine that can apply either tensile or compressive forces to a specimen in small, accurately measured steps. British Standard 18 gives the standard procedure for such a test. Test specimens of a material are made to standard shapes and sizes and two typical test pieces are shown in Figure 24.1. The results of a tensile test may be plotted on a load/extension graph and a typical graph for a mild steel specimen is shown in Figure 24.2.

(i) Between A and B is the region in which Hooke’s law applies and stress is directly proportional to strain. The gradient of AB is used when determining Young’s modulus of elasticity (see Chapter 23).

(ii) Point B is the limit of proportionality and is the point at which stress is no longer proportional to strain when a further load is applied.

(iii) Point C is the elastic limit and a specimen loaded to this point will effectively return to its original length when the load is removed, i.e.

there is negligible permanent extension.

(iv) Point D is called the yield point and at this point there is a sudden extension with no increase in load. The yield stress of the material is given by:

image

(v) Between points D and E extension takes place over the whole gauge length of the specimen.

(vi) Point E gives the maximum load which can be applied to the specimen and is used to determine the ultimate tensile strength (UTS) of the specimen (often just called the tensile strength)

image

(vii) Between points E and F the cross-sectional area of the specimen decreases, usually about half way between the ends, and a waist or neck is formed before fracture.

image

The percentage reduction in area provides information about the malleability of the material (see Chapter 23).

The value of stress at point F is greater than at point E since although the load on the specimen is decreasing as the extension increases, the cross-sectional area is also reducing.

(viii) At point F the specimen fractures.

(ix) Distance GH is called the permanent elongation and

image

For example, a rectangular zinc specimen is subjected to a tensile test and the data from the test is shown below. Width of specimen 40 mm; breadth of specimen 2.5 mm; gauge length 120 mm.

image

Fracture occurs when the extension is 5.0 mm and the maximum load recorded is 38.5 kN.

A load/extension graph is shown in Figure 24.3

The limit of proportionality occurs at point P on the graph, where the initial gradient of the graph starts to change. This point has a load value of 26.5 kN.

Stress at the limit of proportionality is given by:

image

image