Properties of Water and Steam

Properties of Water and Steam

Principle of Conservation of Energy

When two systems are at different temperatures, the transfer of energy from one system to the other is called heat transfer. For a block of hot metal cooling in air, heat is transferred from the hot metal to the cool air.

The principle of conservation of energy may be stated as

energy cannot be created nor can it be destroyed

and since heat is a form of energy, this law applies to heat transfer problems.

A more convenient way of expressing this law when referring to heat transfer problems is:

image

Internal Energy

Fluids consist of a very large number of molecules moving in random directions within the fluid. When the fluid is heated, the speeds of the molecules are increased, increasing the kinetic energy of the molecules. There is also an increase in volume due to an increase in the average distance between molecules, causing the potential energy of the fluid to increase. The internal energy, U, of a fluid is the sum of the internal kinetic and potential energies of the molecules of a fluid, measured in joules. It is not usual to state the internal energy of a fluid as a particular value in heat transfer problems, since it is normally only the change in internal energy that is required.

The amount of internal energy of a fluid depends on:

(a) the type of fluid; in gases the molecules are well separated and move with high velocities, thus a gaseous fluid has higher internal energy than the same mass of a liquid

(b) the mass of a fluid; the greater the mass, the greater the number of molecules and hence the greater the internal energy

(c) the temperature; the higher the temperature the greater the velocity of the molecules

Enthalpy

The sum of the internal energy and the pressure energy of a fluid is called the enthalpy of the fluid, denoted by the symbol H and measured in joules. The product of pressure p and volume V gives the pressure energy, or work done, i.e.

image

As for internal energy, the actual value of enthalpy is usually unimportant and it is the change in enthalpy that is usually required. In heat transfer problems involving steam and water, water is considered to have zero enthalpy at a standard pressure of 101 kPa and a temperature of 0°C. The word ‘specific’ associated with quantities indicates ‘per unit mass’. Thus the specific enthalpy is obtained by dividing the enthalpy by the mass and is denoted by the symbol h. Thus:

image

The units of specific enthalpy are joules per kilogram (J/kg)

For example, in a closed system, that is, a system in which the mass of fluid remains a constant, the internal energy changes from 25 kJ to 50 kJ and the work done by the system is 55 kJ. The heat transferred to the system to effect this change is given by:

image

That is, the heat transferred to the system is 80 kJ

Sensible Heat

The specific enthalpy of water, hf , at temperature 8°C is the quantity of heat needed to raise 1 kg of water from 0°C to 8°C, and is called the sensible heat of the water. Its value is given by:

specific heat capacity of water (c) x temperature change

image

The specific heat capacity of water varies with temperature and pressure but is normally taken as 4.2 kJ/kg, thus

image

Saturated Steam

When water is heated at a uniform rate, a stage is reached (at 100° C at standard atmospheric pressure) where the addition of more heat does not result in a corresponding increase in temperature. The temperature at which this occurs is called the saturation temperature, tSAT , and the water is called saturated water. As heat is added to saturated water, it is turned into saturated steam. The amount of heat required to turn 1 kg of saturated water into saturated steam is called the specific latent heat of vaporisation, and is given the symbol, hfg . The total specific enthalpy of steam at saturation temperature, hg , is given by:

the specific sensible heat  +  the specific latent heat of vaporization

image

Dryness Factor

If the amount of heat added to saturated water is insufficient to turn all the water into steam, then the ratio:

image

is called the dryness fraction of the steam, denoted by the symbol q. The steam is called wet steam and its total enthalpy h is given by:

image

Superheated Steam

When the amount of heat added to water at saturation temperature is sufficient to turn all the water into steam, it is called either saturated vapour or dry saturated steam. The addition of further heat results in the temperature of the steam rising and it is then called superheated steam. The specific enthalpy of superheated steam above that of dry saturated steam is given by:

c(tSUP Ł tSAT), where c is the specific heat capacity of the steam and tSUP is the temperature of the superheated steam. The total specific enthalpy of the superheated steam is given by:

image

Temperature/Specific Enthalpy Graph

The relationship between temperature and specific enthalpy can be shown graphically and a typical temperature/specific enthalpy diagram is shown in Figure 35.1. In this figure, AB represents the sensible heat region where any increase in enthalpy results in a corresponding increase in temperature. BC is called the evaporation line and points between B and C represent the wet steam region (or latent region), point C representing dry saturated steam. Points to the right of C represent the superheated steam region.

image

Steam Tables

The boiling point of water, tSAT and the various specific enthalpies associated with water and steam [hf , hfg and c(tSUP Ł tSAT)] all vary with pressure. These values at various pressures have been tabulated in steam tables, extracts from these being shown in Tables 35.1 and 35.2

In Table 35.1, the pressure in both bar and kilopascals, and saturated water temperature, are shown in columns on the left. The columns on the right give the corresponding specific enthalpies of water (hf) and dry sat- urated steam (hg ), together with the specific enthalpy of the latent heat of vaporization (hfg ). The columns on the right of Table 35.2 give the specific

image

image

enthalpies of dry saturated steam (hg) and superheated steam at various temperatures. The values stated refer to zero enthalpy. However, if the degree of superheat is given, this refers to the saturation temperature. Thus at a pressure of 100 kPa, the column headed, say, 250° C has a degree of superheat of (250 Ł 99.6)°C, that is 150.4° C.

For example, let some dry saturated steam at a pressure of 1.0 MPa be cooled at constant pressure until it has a dryness fraction of 0.6. The change in the specific enthalpy of the steam is determined as follows:

From Table 35.1, the specific enthalpy of dry saturated steam hg , at a pressure of 1.0 MPa (i.e. 1000 kPa) is 2778 kJ/kg. From earlier, the specific enthalpy of wet steam is hf C qhfg . At a pressure of 1.0 MPa, hf is 763 kJ/kg and hfg is 2015 kJ/kg. Thus, the specific enthalpy of the wet steam is given by:

image

Superheated steam behaves very nearly as if it is an ideal gas and the gas laws introduced in Chapter 34 may be used to determine the relationship between pressure, volume and temperature.


Ideal gas Laws

Ideal gas Laws

Introduction

The relationships that exist between pressure, volume and temperature in a gas are given in a set of laws called the gas laws.

Boyle’s Law

Boyle’s law states:

the volume V of a fixed mass of gas is inversely proportional to its absolute pressure p at constant temperature

image

Charles’ Law

Charles’ law states:

for a given mass of gas at constant pressure, the volume V is directly proportional to its thermodynamic temperature T

image

A process that takes place at constant pressure is called an isobaric process.

The relationship between the Celsius scale of temperature and the thermodynamic or absolute scale is given by:

image

The Pressure Law

The pressure law states:

the pressure p of a fixed mass of gas is directly proportional to its thermodynamic temperature T at constant volume

image

When a fixed mass of gas at constant volume changes from pressure p1 and temperature T1, to pressure p2 and temperature T2 then:

image

For example, gas initially at a temperature of 17° C and pressure 150 kPa is heated at constant volume until its temperature is 124° C. Assuming no loss of gas, the final pressure of the gas is determined from:

image

Dalton’s Law of Partial Pressure

Dalton’s law of partial pressure states:

the total pressure of a mixture of gases occupying a given volume is equal to the sum of the pressures of each gas, considered separately, at constant temperature The pressure of each constituent gas when occupying a fixed volume alone is known as the partial pressure of that gas.

An ideal gas is one that completely obeys the gas laws given above. In practice no gas is an ideal gas, although air is very close to being one. For calculation purposes the difference between an ideal and an actual gas is very small.

For example, a gas R in a container exerts a pressure of 200 kPa at a temperature of 18°C. Gas Q is added to the container and the pressure increases to 320 kPa at the same temperature. The pressure that gas Q alone exerts at the same temperature, is given by Dalton’s law of partial pressure:

image

Characteristic Gas Equation

Frequently, when a gas is undergoing some change, the pressure, temperature and volume all vary simultaneously. Provided there is no change in the mass of a gas, the above gas laws can be combined, giving:

image

For an ideal gas, constant k D mR, where m is the mass of the gas in kg, and R is the characteristic gas constant, i.e.

image

This is called the characteristic gas equation. In this equation, p D absolute pressure in pascals, V D volume in m3, m D mass in kg, R D characteristic gas constant in J/(kg K), and T D thermodynamic temperature in kelvin.

Some typical values of the characteristic gas constant R include:

air, 287 J/(kg K), hydrogen 4160 J/(kg K), oxygen 260 J/(kg K) and carbon dioxide 184 J/(kg K).

For example, some air at a temperature of 40°C and pressure 4 bar occupies a volume of 0.05 m3. The mass of the air, assuming the characteristic gas constant for air to be 287 J/(kg K), is determined from: pV D mRT, from which, mass of air,

image

Standard temperature and pressure (i.e. STP) refers to a temperature of 0°C, i.e. 273 K, and normal atmospheric pressure of 101.325 kPa

Kinetic Theory of Gases

The kinetic theory of gases suggests that gases are composed of particles in motion. The continual bombardment of any surface by the gas causes a pressure to be exerted; the greater the density of a gas, the more frequent the number of collisions between molecules and the surface and the greater the pressure exerted. Hence the pressure increases either when the volume of a certain mass of gas is reduced, or when more gas is pumped into a vessel. When the temperature of a gas is increased, the speed of the molecules increases, causing an increase in both the number and the momentum imparted by each collision. This accounts for the increase in pressure of a gas with increase in temperature.

Maxwell (in 1860) explained some of the properties of a gas by assuming that the molecules of a gas make elastic collisions, spend negligible time actually in collision, and themselves occupy a negligible part of the volume of the gas. Also, the attractive forces between molecules are assumed negligible.

It may be shown that for gas occupying a volume V at a pressure p and containing n molecules each of mass m moving at an average velocity of c,

image

Also, the kinetic energy of the molecules of a gas is proportional to its thermodynamic temperature.

When a liquid evaporates, molecules with sufficient kinetic energy escape from the liquid’s surface. The higher the temperature of the liquid the greater the average kinetic energy of the molecules and the greater the number of molecules that are able to escape. Since it is the molecules with the highest kinetic energy that escape, the average kinetic energy of the remaining molecules decreases and thus the liquid cools.

If a liquid evaporates a vapour is formed. When a vapour exists in the presence of its own liquid a saturated vapour is formed. If all the liquid evaporates an unsaturated vapour is produced. The higher the temperature the greater the number of molecules that escapes to form the vapour. These molecules bombard the walls of the container and thus exert a pressure.

The saturated vapour pressure depends only on the temperature of the vapour. The saturated vapour pressure of water at various temperatures is shown in Table 34.1. A liquid boils at a temperature when its saturated vapour pressure is equal to the atmospheric pressure. Thus water will boil at a temperature greater than 100° C if the atmospheric pressure is increased. This is the principle of the pressure cooker.

A saturated vapour does not obey the gas laws since its pressure depends only on temperature. An unsaturated vapour will obey the gas laws fairly

image

closely as long as it remains unsaturated. If an unsaturated vapour at a particular temperature is decreased in volume its pressure will rise in accordance with Boyle’s law until it reaches the saturated vapour pressure at that particular temperature (see Figure 34.1). When the vapour pressure at 40° C reaches 7.35 x 10³ Pa the vapour becomes saturated as it starts to liquefy.


Ideal gas Laws

Ideal gas Laws

Introduction

The relationships that exist between pressure, volume and temperature in a gas are given in a set of laws called the gas laws.

Boyle’s Law

Boyle’s law states:

the volume V of a fixed mass of gas is inversely proportional to its absolute pressure p at constant temperature

image

Charles’ Law

Charles’ law states:

for a given mass of gas at constant pressure, the volume V is directly proportional to its thermodynamic temperature T

image

A process that takes place at constant pressure is called an isobaric process.

The relationship between the Celsius scale of temperature and the thermodynamic or absolute scale is given by:

image

The Pressure Law

The pressure law states:

the pressure p of a fixed mass of gas is directly proportional to its thermodynamic temperature T at constant volume

image

When a fixed mass of gas at constant volume changes from pressure p1 and temperature T1, to pressure p2 and temperature T2 then:

image

For example, gas initially at a temperature of 17° C and pressure 150 kPa is heated at constant volume until its temperature is 124° C. Assuming no loss of gas, the final pressure of the gas is determined from:

image

Dalton’s Law of Partial Pressure

Dalton’s law of partial pressure states:

the total pressure of a mixture of gases occupying a given volume is equal to the sum of the pressures of each gas, considered separately, at constant temperature The pressure of each constituent gas when occupying a fixed volume alone is known as the partial pressure of that gas.

An ideal gas is one that completely obeys the gas laws given above. In practice no gas is an ideal gas, although air is very close to being one. For calculation purposes the difference between an ideal and an actual gas is very small.

For example, a gas R in a container exerts a pressure of 200 kPa at a temperature of 18°C. Gas Q is added to the container and the pressure increases to 320 kPa at the same temperature. The pressure that gas Q alone exerts at the same temperature, is given by Dalton’s law of partial pressure:

image

Characteristic Gas Equation

Frequently, when a gas is undergoing some change, the pressure, temperature and volume all vary simultaneously. Provided there is no change in the mass of a gas, the above gas laws can be combined, giving:

image

For an ideal gas, constant k D mR, where m is the mass of the gas in kg, and R is the characteristic gas constant, i.e.

image

This is called the characteristic gas equation. In this equation, p D absolute pressure in pascals, V D volume in m3, m D mass in kg, R D characteristic gas constant in J/(kg K), and T D thermodynamic temperature in kelvin.

Some typical values of the characteristic gas constant R include:

air, 287 J/(kg K), hydrogen 4160 J/(kg K), oxygen 260 J/(kg K) and carbon dioxide 184 J/(kg K).

For example, some air at a temperature of 40°C and pressure 4 bar occupies a volume of 0.05 m3. The mass of the air, assuming the characteristic gas constant for air to be 287 J/(kg K), is determined from: pV D mRT, from which, mass of air,

image

Standard temperature and pressure (i.e. STP) refers to a temperature of 0°C, i.e. 273 K, and normal atmospheric pressure of 101.325 kPa

Kinetic Theory of Gases

The kinetic theory of gases suggests that gases are composed of particles in motion. The continual bombardment of any surface by the gas causes a pressure to be exerted; the greater the density of a gas, the more frequent the number of collisions between molecules and the surface and the greater the pressure exerted. Hence the pressure increases either when the volume of a certain mass of gas is reduced, or when more gas is pumped into a vessel. When the temperature of a gas is increased, the speed of the molecules increases, causing an increase in both the number and the momentum imparted by each collision. This accounts for the increase in pressure of a gas with increase in temperature.

Maxwell (in 1860) explained some of the properties of a gas by assuming that the molecules of a gas make elastic collisions, spend negligible time actually in collision, and themselves occupy a negligible part of the volume of the gas. Also, the attractive forces between molecules are assumed negligible.

It may be shown that for gas occupying a volume V at a pressure p and containing n molecules each of mass m moving at an average velocity of c,

image

Also, the kinetic energy of the molecules of a gas is proportional to its thermodynamic temperature.

When a liquid evaporates, molecules with sufficient kinetic energy escape from the liquid’s surface. The higher the temperature of the liquid the greater the average kinetic energy of the molecules and the greater the number of molecules that are able to escape. Since it is the molecules with the highest kinetic energy that escape, the average kinetic energy of the remaining molecules decreases and thus the liquid cools.

If a liquid evaporates a vapour is formed. When a vapour exists in the presence of its own liquid a saturated vapour is formed. If all the liquid evaporates an unsaturated vapour is produced. The higher the temperature the greater the number of molecules that escapes to form the vapour. These molecules bombard the walls of the container and thus exert a pressure.

The saturated vapour pressure depends only on the temperature of the vapour. The saturated vapour pressure of water at various temperatures is shown in Table 34.1. A liquid boils at a temperature when its saturated vapour pressure is equal to the atmospheric pressure. Thus water will boil at a temperature greater than 100° C if the atmospheric pressure is increased. This is the principle of the pressure cooker.

A saturated vapour does not obey the gas laws since its pressure depends only on temperature. An unsaturated vapour will obey the gas laws fairly

image

closely as long as it remains unsaturated. If an unsaturated vapour at a particular temperature is decreased in volume its pressure will rise in accordance with Boyle’s law until it reaches the saturated vapour pressure at that particular temperature (see Figure 34.1). When the vapour pressure at 40° C reaches 7.35 x 10³ Pa the vapour becomes saturated as it starts to liquefy.


Pressure in Fluids

Pressure in Fluids

Pressure

The pressure acting on a surface is defined as the perpendicular force per unit area of surface. The unit of pressure is the pascal, Pa, where 1 pascal is equal to 1 newton per square metre. Thus

image

where F is the force in newtons acting at right angles to a surface of area A square metres.

For example, when a force of 20 N acts uniformly over, and perpendicular to, an area of 4 m2, then the pressure on the area, p, is given by:

image

Fluid Pressure

A fluid is either a liquid or a gas and there are four basic factors governing the pressure within fluids.

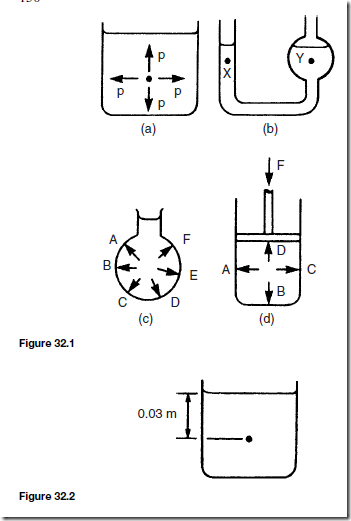
(a) The pressure, at a given depth, in a fluid is equal in all directions, as shown in Figure 32.1(a).

(b) The pressure at a given depth in a fluid is independent of the shape of the container in which the fluid is held. In Figure 32.1(b), the pressure at X is the same as the pressure at Y.

(c) Pressure acts at right angles to the surface containing the fluid. In Figure 32.1(c), the pressures at points A to F all act at right angles to the container.

(d) When a pressure is applied to a fluid, this pressure is transmitted equally in all directions. In Figure 32.1(d), if the mass of the fluid is neglected, the pressures at points A to D are all the same.

The pressure, p, at any point in a fluid depends on three factors:

(i) the density of the fluid, p, in kg/m3

(ii) the gravitational acceleration, g, taken as approximately 9.81 m/s2 (or the gravitational field force in N/kg), and

(iii) the height of fluid vertically above the point, h metres.

The relationship connecting these quantities is: image

image

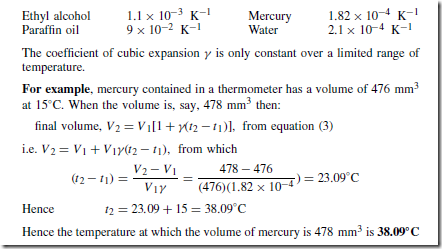
For example, when the container shown in Figure 32.2 is filled with water of density 1000 kg/m3 , the pressure due to the water at a depth of 0.03 m below the surface is given by: p = pgh = (1000 x 9.81 x 0.03) = 294.3 Pa

Atmospheric Pressure

The air above the earth’s surface is a fluid, having a density, p, which varies from approximately 1.225 kg/m3 at sea level to zero in outer space. Since p = pgh, where height h is several thousands of metres, the air exerts a pressure on all points on the earth’s surface. This pressure, called atmospheric pressure, has a value of approximately 101 kilopascals. Two terms are commonly used when measuring pressures:

(a) absolute pressure, meaning the pressure above that of an absolute vacuum (which is zero pressure), and

(b) gauge pressure, meaning the pressure above that normally present due to the atmosphere.

Thus: absolute pressure = atmospheric pressure + gauge pressure

Thus, a gauge pressure of 50 kPa is equivalent to an absolute pressure of (100 C 50) kPa, i.e. 150 kPa, since the atmospheric pressure is approximately 100 kPa.

For example, the absolute pressure at a point on a submarine, at a depth of 30 m below the surface of the sea, when the atmospheric pressure is 101 kPa (taking the density of sea water as 1030 kg/m3 and the gravitational acceleration as 9.81 m/s2) is calculated as follows:

The pressure due to the sea, that is, the gauge pressure (pg ) is given by:

image

Archimedes’ Principle

Archimedes’ principle states that:

If a solid body floats, or is submerged, in a liquid, the liquid exerts an upthrust on the body equal to the gravitational force on the liquid displaced by the body

In other words, if a solid body is immersed in a liquid, the apparent loss of weight is equal to the weight of liquid displaced. If V is the volume of the body below the surface of the liquid, then the apparent loss of weight W is given by:

image

where ω is the specific weight (i.e. weight per unit volume) and p is the density. If a body floats on the surface of a liquid all of its weight appears to have been lost. The weight of liquid displaced is equal to the weight of the floating body.

For example, a body weighs 2.760 N in air and 1.925 N when completely immersed in water of density 1000 kg/m3 .

The apparent loss of weight is: 2.760 N – 1.925 N D 0.835 N

This is the weight of water displaced, i.e. Vpg, where V is the volume of the body and p is the density of water.

image

Measurement of Pressure

There are various ways of measuring pressure, and these include by:

(a) barometers,

(b) manometers,

(c) pressure gauges, and

(d) vacuum gauges.

The construction and principle of operation of each of these devices are described in Chapter 33.

Let us look briefly at just one of these instruments — the manometer. A manometer is a device used for measuring relatively small pressures, either above or below atmospheric pressure. A simple U-tube manometer is shown in Figure 32.3. Pressure p acting in, say, a gas main, pushes the liquid in the

image

U-tube until equilibrium is obtained. At equilibrium:

image

The gauge pressure of the gas is 2.94 kPa.

By filling the U-tube with a more dense liquid, say, mercury having a density of 13 600 kg/m3 , for a given height of U-tube, the pressure which can be measured is increased by a factor of 13.6.

More on Hydrostatic Pressure

The pressure p at the base of the tank shown in Figure 32.4(a) is:

image

where w is the specific weight, i.e. the weight per unit volume, its unit being N/m3.

The pressure increases to this value uniformly from zero at the free surface.

The pressure variation is shown in Figure 32.4(b).

At any intermediate depth x the pressure is: image It may be shown that the average pressure on any wetted plane surface is the pressure at the centroid, the centre of area. The sloping sides of the tank

image

image

For a tank with vertical sides this is the weight of liquid in the tank.

In any vessel containing homogeneous liquid at rest and in continuous contact, the pressure must be the same at all points at the same level. In a U-tube, as shown in Figure 32.5, with the liquid in the lower part at rest, the pressure must be the same on both sides for all levels up to X1X2. The pressure at X1, however, is greater than the pressure at Y1 by the amount p1 D w1 h D p1gh, where w1 , p1 are the specific weight and density respectively of the liquid, or gas, between X1 and Y1 .

Similarly, the pressure at X2 is greater than the pressure at Y2 by an amount given by p2 D w2h D p2gh, where w2 and p2 are the specific weight and density respectively of the liquid in the bottom of the U-tube.

For practical reasons, p2 must be greater than p1 and the pressure at Y1 will exceed that at Y2 by: p2 – p1 D (w2 – w1)h D (p2 – p1)gh If the upper limits of the U-tube contain air or any other gas or gas mixture, w1 and p1 can reasonably be ignored, giving: p2 – p1 D w2 h D p2 gh

image

If the upper limbs contain a lighter liquid, then the pressure difference may be expressed as: image

A common arrangement is mercury and water, in which case d is the relative density of mercury, approximately 13.6. This gives: p2 – p1 D 12.6pgh D 12.6wh, p and w being respectively the density and specific weight of water. The pressure difference at Z1Z2 will be the same as Y1 Y2 if both limbs contain the same liquid between these levels. This follows from the fact that the pressure increase from Z1 to Y1 is the same as the increase from Z2 to Y2.

For example, the pressure difference between two points on a horizontal pipe carrying water and running full is to be indicated on a U-tube below the pipe. The bottom of the U-tube contains mercury; the rest is filled with water. Taking the density of water as 1000 kg/m3 and the relative density of mercury as 13.6, the pressure difference indicated when the difference in the mercury levels in the U-tube is 310 mm is determined as follows:

The pressure difference at level XX0 in Figure 32.6 is the same as the pressure difference between the two points in the pipe.

At level YY0 , however, there is no pressure difference, as below this there is a U-tube of mercury at rest. The difference in pressure at XX0 and hence between the points on the pipe is therefore the difference in pressure between that due to a column of mercury 310 mm high (i.e. X0Y0) and that due to a column of water 310 mm (i.e. XY). The pressure difference is therefore:

image


Pressure in Fluids

Pressure in Fluids

Pressure

The pressure acting on a surface is defined as the perpendicular force per unit area of surface. The unit of pressure is the pascal, Pa, where 1 pascal is equal to 1 newton per square metre. Thus

image

where F is the force in newtons acting at right angles to a surface of area A square metres.

For example, when a force of 20 N acts uniformly over, and perpendicular to, an area of 4 m2, then the pressure on the area, p, is given by:

image

Fluid Pressure

A fluid is either a liquid or a gas and there are four basic factors governing the pressure within fluids.

(a) The pressure, at a given depth, in a fluid is equal in all directions, as shown in Figure 32.1(a).

(b) The pressure at a given depth in a fluid is independent of the shape of the container in which the fluid is held. In Figure 32.1(b), the pressure at X is the same as the pressure at Y.

(c) Pressure acts at right angles to the surface containing the fluid. In Figure 32.1(c), the pressures at points A to F all act at right angles to the container.

(d) When a pressure is applied to a fluid, this pressure is transmitted equally in all directions. In Figure 32.1(d), if the mass of the fluid is neglected, the pressures at points A to D are all the same.

The pressure, p, at any point in a fluid depends on three factors:

(i) the density of the fluid, p, in kg/m3

(ii) the gravitational acceleration, g, taken as approximately 9.81 m/s2 (or the gravitational field force in N/kg), and

(iii) the height of fluid vertically above the point, h metres.

The relationship connecting these quantities is: image

image

For example, when the container shown in Figure 32.2 is filled with water of density 1000 kg/m3 , the pressure due to the water at a depth of 0.03 m below the surface is given by: p = pgh = (1000 x 9.81 x 0.03) = 294.3 Pa

Atmospheric Pressure

The air above the earth’s surface is a fluid, having a density, p, which varies from approximately 1.225 kg/m3 at sea level to zero in outer space. Since p = pgh, where height h is several thousands of metres, the air exerts a pressure on all points on the earth’s surface. This pressure, called atmospheric pressure, has a value of approximately 101 kilopascals. Two terms are commonly used when measuring pressures:

(a) absolute pressure, meaning the pressure above that of an absolute vacuum (which is zero pressure), and

(b) gauge pressure, meaning the pressure above that normally present due to the atmosphere.

Thus: absolute pressure = atmospheric pressure + gauge pressure

Thus, a gauge pressure of 50 kPa is equivalent to an absolute pressure of (100 C 50) kPa, i.e. 150 kPa, since the atmospheric pressure is approximately 100 kPa.

For example, the absolute pressure at a point on a submarine, at a depth of 30 m below the surface of the sea, when the atmospheric pressure is 101 kPa (taking the density of sea water as 1030 kg/m3 and the gravitational acceleration as 9.81 m/s2) is calculated as follows:

The pressure due to the sea, that is, the gauge pressure (pg ) is given by:

image

Archimedes’ Principle

Archimedes’ principle states that:

If a solid body floats, or is submerged, in a liquid, the liquid exerts an upthrust on the body equal to the gravitational force on the liquid displaced by the body

In other words, if a solid body is immersed in a liquid, the apparent loss of weight is equal to the weight of liquid displaced. If V is the volume of the body below the surface of the liquid, then the apparent loss of weight W is given by:

image

where ω is the specific weight (i.e. weight per unit volume) and p is the density. If a body floats on the surface of a liquid all of its weight appears to have been lost. The weight of liquid displaced is equal to the weight of the floating body.

For example, a body weighs 2.760 N in air and 1.925 N when completely immersed in water of density 1000 kg/m3 .

The apparent loss of weight is: 2.760 N – 1.925 N D 0.835 N

This is the weight of water displaced, i.e. Vpg, where V is the volume of the body and p is the density of water.

image

Measurement of Pressure

There are various ways of measuring pressure, and these include by:

(a) barometers,

(b) manometers,

(c) pressure gauges, and

(d) vacuum gauges.

The construction and principle of operation of each of these devices are described in Chapter 33.

Let us look briefly at just one of these instruments — the manometer. A manometer is a device used for measuring relatively small pressures, either above or below atmospheric pressure. A simple U-tube manometer is shown in Figure 32.3. Pressure p acting in, say, a gas main, pushes the liquid in the

image

U-tube until equilibrium is obtained. At equilibrium:

image

The gauge pressure of the gas is 2.94 kPa.

By filling the U-tube with a more dense liquid, say, mercury having a density of 13 600 kg/m3 , for a given height of U-tube, the pressure which can be measured is increased by a factor of 13.6.

More on Hydrostatic Pressure

The pressure p at the base of the tank shown in Figure 32.4(a) is:

image

where w is the specific weight, i.e. the weight per unit volume, its unit being N/m3.

The pressure increases to this value uniformly from zero at the free surface.

The pressure variation is shown in Figure 32.4(b).

At any intermediate depth x the pressure is: image It may be shown that the average pressure on any wetted plane surface is the pressure at the centroid, the centre of area. The sloping sides of the tank

image

image

For a tank with vertical sides this is the weight of liquid in the tank.

In any vessel containing homogeneous liquid at rest and in continuous contact, the pressure must be the same at all points at the same level. In a U-tube, as shown in Figure 32.5, with the liquid in the lower part at rest, the pressure must be the same on both sides for all levels up to X1X2. The pressure at X1, however, is greater than the pressure at Y1 by the amount p1 D w1 h D p1gh, where w1 , p1 are the specific weight and density respectively of the liquid, or gas, between X1 and Y1 .

Similarly, the pressure at X2 is greater than the pressure at Y2 by an amount given by p2 D w2h D p2gh, where w2 and p2 are the specific weight and density respectively of the liquid in the bottom of the U-tube.

For practical reasons, p2 must be greater than p1 and the pressure at Y1 will exceed that at Y2 by: p2 – p1 D (w2 – w1)h D (p2 – p1)gh If the upper limits of the U-tube contain air or any other gas or gas mixture, w1 and p1 can reasonably be ignored, giving: p2 – p1 D w2 h D p2 gh

image

If the upper limbs contain a lighter liquid, then the pressure difference may be expressed as: image

A common arrangement is mercury and water, in which case d is the relative density of mercury, approximately 13.6. This gives: p2 – p1 D 12.6pgh D 12.6wh, p and w being respectively the density and specific weight of water. The pressure difference at Z1Z2 will be the same as Y1 Y2 if both limbs contain the same liquid between these levels. This follows from the fact that the pressure increase from Z1 to Y1 is the same as the increase from Z2 to Y2.

For example, the pressure difference between two points on a horizontal pipe carrying water and running full is to be indicated on a U-tube below the pipe. The bottom of the U-tube contains mercury; the rest is filled with water. Taking the density of water as 1000 kg/m3 and the relative density of mercury as 13.6, the pressure difference indicated when the difference in the mercury levels in the U-tube is 310 mm is determined as follows:

The pressure difference at level XX0 in Figure 32.6 is the same as the pressure difference between the two points in the pipe.

At level YY0 , however, there is no pressure difference, as below this there is a U-tube of mercury at rest. The difference in pressure at XX0 and hence between the points on the pipe is therefore the difference in pressure between that due to a column of mercury 310 mm high (i.e. X0Y0) and that due to a column of water 310 mm (i.e. XY). The pressure difference is therefore:

image


Measurement of Pressure.

Measurement of Pressure

Introduction

As stated in Chapter 32, pressure is the force exerted by a fluid per unit area. A fluid (i.e. liquid, vapour or gas) has a negligible resistance to a shear force, so that the force it exerts always acts at right angles to its containing surface. The SI unit of pressure is the pascal, Pa, which is unit force per unit area, i.e. 1 Pa = 1 N/m2 . The pascal is a very small unit and a commonly used larger unit is the bar, where 1 bar = 105 Pa

Atmospheric pressure is due to the mass of the air above the earth’s surface. Atmospheric pressure changes continuously. A standard value of atmospheric pressure, called ‘standard atmospheric pressure’, is often used, having a value of 101 325 Pa or 1.01325 bars or 1013.25 millibars. This latter unit, the millibar, is usually used in the measurement of meteorological pres- sures. (Note that when atmospheric pressure varies from 101 325 Pa it is no longer standard.)

Pressure indicating instruments are made in a wide variety of forms because of their many different applications. Apart from the obvious criteria such as pressure range, accuracy and response, many measurements also require special attention to material, sealing and temperature effects. The fluid whose pressure is being measured may be corrosive or may be at high temperatures. Pressure indicating devices used in science and industry include:

(i) barometers

(ii) manometers

(iii) Bourdon pressure gauge

(iv) McLeod and Pirani gauges

Barometers

A barometer is an instrument for measuring atmospheric pressure. It is affected by seasonal changes of temperature. Barometers are therefore also used for the measurement of altitude and also as one of the aids in weather forecasting. The value of atmospheric pressure will thus vary with climatic conditions, although not usually by more than about 10% of standard atmospheric pressure.

Construction and principle of operation

A simple barometer consists of a glass tube, just under 1 m in length, sealed at one end, filled with mercury and then inverted into a trough containing more mercury. Care must be taken to ensure that no air enters the tube during this latter process. Such a barometer is shown in Figure 33.1(a) and it is seen that the level of the mercury column falls, leaving an empty space, called a vacuum. Atmospheric pressure acts on the surface of the mercury in the trough

image

as shown and this pressure is equal to the pressure at the base of the column of mercury in the inverted tube, i.e. the pressure of the atmosphere is supporting the column of mercury. If the atmospheric pressure falls the barometer height h decreases. Similarly, if the atmospheric pressure rises then h increases. Thus atmospheric pressure can be measured in terms of the height of the mercury column. It may be shown that for mercury the height h is 760 mm at standard atmospheric pressure, i.e. a vertical column of mercury 760 mm high exerts a pressure equal to the standard value of atmospheric pressure.

There are thus several ways in which atmospheric pressure can be expressed:

image

Another arrangement of a typical barometer is shown in Figure 33.1(b) where a U-tube is used instead of an inverted tube and trough, the principle being similar. If, instead of mercury, water was used as the liquid in a barometer, then the barometric height h at standard atmospheric pressure would be 13.6 times more than for mercury, i.e. about 10.4 m high, which is not very practicable. This is because the relative density of mercury is 13.6

Types of barometer

The Fortin barometer is an example of a mercury barometer that enables barometric heights to be measured to a high degree of accuracy (in the order of one-tenth of a millimetre or less). Its construction is merely a more sophisticated arrangement of the inverted tube and trough shown in Figure 33.1(a), with the addition of a vernier scale to measure the barometric height with great accuracy. A disadvantage of this type of barometer is that it is not portable.

A Fortin barometer is shown in Figure 33.2. Mercury is contained in a leather bag at the base of the mercury reservoir, and height, H, of the mercury in the reservoir can be adjusted using the screw at the base of the barometer to depress or release the leather bag. To measure the atmospheric pressure the screw is adjusted until the pointer at H is just touching the surface of the mercury and the height of the mercury column is then read using the main and vernier scales. The measurement of atmospheric pressure using a Fortin barometer is achieved much more accurately than by using a simple barometer.

image

image

A portable type often used is the aneroid barometer. Such a barometer consists basically of a circular, hollow, sealed vessel, S, and usually made from thin flexible metal. The air pressure in the vessel is reduced to nearly zero before sealing, so that a change in atmospheric pressure will cause the shape of the vessel to expand or contract. These small changes can be magnified by means of a lever and be made to move a pointer over a calibrated scale. Figure 33.3 shows a typical arrangement of an aneroid barometer. The scale is usually circular and calibrated in millimetres of mercury. These instruments require frequent calibration.

Absolute and Gauge Pressure

A barometer measures the true or absolute pressure of the atmosphere. The term absolute pressure means the pressure above that of an absolute vacuum (which is zero pressure). In Figure 33.4 a pressure scale is shown with the line AB representing absolute zero pressure (i.e. a vacuum) and line CD representing atmospheric pressure. With most practical pressure-measuring instruments the part of the instrument that is subjected to the pressure being measured is also subjected to atmospheric pressure. Thus practical instruments actually determine the difference between the pressure being measured and atmospheric pressure. The pressure that the instrument is measuring is then termed the gauge pressure. In Figure 33.4, the line EF represents an absolute pressure that has a value greater than atmospheric pressure, i.e. the ‘gauge’ pressure is positive.

Thus,

absolute pressure = gauge pressure + atmospheric pressure

Hence a gauge pressure of, say, 60 kPa recorded on an indicating instrument when the atmospheric pressure is 101 kPa is equivalent to an absolute pressure of 60 kPa C 101 kPa, or 161 kPa.

image

Pressure-measuring indicating instruments are referred to generally as pressure gauges (which acts as a reminder that they measure ‘gauge’ pressure).

It is possible, of course, for the pressure indicated on a pressure gauge to be below atmospheric pressure, i.e. the gauge pressure is negative. Such a gauge pressure is often referred to as a vacuum, even though it does not necessarily represent a complete vacuum at absolute zero pressure. The line GH in Figure 30.4 shows such a pressure. An indicating instrument used for measuring such pressures is called a vacuum gauge.

A vacuum gauge indication of, say, 0.4 bar means that the pressure is 0.4 bar less than atmospheric pressure. If atmospheric pressure is 1 bar, then the absolute pressure is 1– 0.4 or 0.6 bar.

The Manometer

A manometer is a device for measuring or comparing fluid pressures, and is the simplest method of indicating such pressures.

U-tube manometer

A U-tube manometer consists of a glass tube bent into a U shape and containing a liquid such as mercury. A U-tube manometer is shown in Figure 33.5(a). If limb A is connected to a container of gas whose pressure is above atmospheric, then the pressure of the gas will cause the levels of mercury to move as shown in Figure 33.5(b), such that the difference in height is h1 . The measuring scale can be calibrated to give the gauge pressure of the gas as h1 mm of mercury.

If limb A is connected to a container of gas whose pressure is below atmospheric then the levels of mercury will move as shown in Figure 33.5(c), such that their pressure difference is h2 mm of mercury.

It is also possible merely to compare two pressures, say, PA and PB , using a U-tube manometer. Figure 33.5(d) shows such an arrangement with

image

(PB – PA) equivalent to h mm of mercury. One application of this differential pressure-measuring device is in determining the velocity of fluid flow in pipes (see Chapter 38).

For the measurement of lower pressures, water or paraffin may be used instead of mercury in the U-tube to give larger values of h and thus greater sensitivity.

Inclined manometers

For the measurement of very low pressures, greater sensitivity is achieved by using an inclined manometer, a typical arrangement of which is shown in Figure 33.6. With the inclined manometer the liquid used is water and the scale attached to the inclined tube is calibrated in terms of the vertical height h. Thus when a vessel containing gas under pressure is connected to the reservoir, movement of the liquid levels of the manometer occurs. Since small-bore tubing is used the movement of the liquid in the reservoir is very small compared with the movement in the inclined tube and is thus neglected. Hence the scale on the manometer is usually used in the range 0.2 mbar to 2 mbar.

image

The length of tube used naturally limits the pressure of a gas that a manometer is capable of measuring. Most manometer tubes are less than 2 m in length and this restricts measurement to a maximum pressure of about 2.5 bar (or 250 kPa) when mercury is used.

The Bourdon Pressure Gauge

Pressures many times greater than atmospheric can be measured by the Bourdon pressure gauge, which is the most extensively used of all pressure- indicating instruments. It is a robust instrument. Its main component is a piece of metal tube (called the Bourdon tube), usually made of phosphor bronze or alloy steel, of oval or elliptical cross-section, sealed at one end and bent into an arc. In some forms the tube is bent into a spiral for greater sensitivity. A typical arrangement is shown in Figure 33.7(a). One end, E, of the Bourdon tube is fixed and the fluid whose pressure is to be measured is connected to this end. The pressure acts at right angles to the metal tube wall as shown in the cross-section of the tube in Figure 33.7(b). Because of its elliptical shape it is clear that the sum of the pressure components, i.e. the total force acting on the sides A and C, exceeds the sum of the pressure components acting on ends B and D. The result is that sides A and C tend to move outwards and B and D inwards tending to form a circular cross-section. As the pressure in the tube is increased the tube tends to uncurl, or if the pressure is reduced the tube curls up further. The movement of the free end of the tube is, for practical purposes, proportional to the pressure applied to the tube, this pressure, of course, being the gauge pressure (i.e. the difference between atmospheric pressure acting on the outside of the tube and the applied pressure acting on the inside of the tube). By using a link, a pivot and a toothed segment as shown in Figure 33.7(a), the movement can be converted into the rotation of a pointer over a graduated calibrated scale.

The Bourdon tube pressure gauge is capable of measuring high pressures up to 104 bar (i.e. 7600 m of mercury) with the addition of special safety features. A pressure gauge must be calibrated, and this is done either

image

by a manometer, for low pressures, or by a piece of equipment called a ‘dead weight tester’. This tester consists of a piston operating in an oil-filled cylinder of known bore, and carrying accurately known weights as shown in Figure 33.8. The gauge under test is attached to the tester and a screwed piston or ram applies the required pressure until the weights are just lifted. While the gauge is being read, the weights are turned to reduce friction effects.

Vacuum Gauges

Vacuum gauges are instruments for giving a visual indication, by means of a pointer, of the amount by which the pressure of a fluid applied to the gauge

image

McLeod gauge

The McLeod gauge is normally regarded as a standard and is used to calibrate other forms of vacuum gauges. The basic principle of this gauge is that it takes a known volume of gas at a pressure so low that it cannot be measured, and then compresses the gas in a known ratio until the pressure becomes large enough to be measured by an ordinary manometer. This device is used to measure low pressures, often in the range 10Ł6 to 1.0 mm of mercury. A disadvantage of the McLeod gauge is that it does not give a continuous reading of pressure and is not suitable for registering rapid variations in pressure.

Pirani gauge

The Pirani gauge measures the resistance and thus the temperature of a wire through which current is flowing. The thermal conductivity decreases with the pressure in the range 10Ł1 to 10Ł4 mm of mercury so that the increase in resistance can be used to measure pressure in this region. The Pirani gauge is calibrated by comparison with a McLeod gauge.


The Measurement of Temperature

The Measurement of Temperature

Introduction

A change in temperature of a substance can often result in a change in one or more of its physical properties. Thus, although temperature cannot be measured directly, its effects can be measured. Some properties of substances used to determine changes in temperature include changes in dimensions, electrical resistance, state, type and volume of radiation, and colour.

Temperature measuring devices available are many and varied. Those described in the following paragraphs are those most often used in science and industry.

Liquid-in-glass Thermometer

A liquid-in-glass thermometer uses the expansion of a liquid with increase in temperature as its principle of operation.

Construction

A typical liquid-in-glass thermometer is shown in Figure 31.1 and consists of a sealed stem of uniform small-bore tubing, called a capillary tube, made of glass, with a cylindrical glass bulb formed at one end. The bulb and part of the stem are filled with a liquid such as mercury or alcohol and the remaining part of the tube is evacuated. Etching graduations on the stem forms a temperature scale. A safety reservoir is usually provided, into which the liquid can expand without bursting the glass if the temperature is raised beyond the upper limit of the scale.

Principle of operation

The operation of a liquid-in-glass thermometer depends on the liquid expand- ing with increase in temperature and contracting with decrease in temperature. The position of the end of the column of liquid in the tube is a measure of the temperature of the liquid in the bulb — shown as 15°C in Figure 31.1, which is about room temperature. Two fixed points are needed to calibrate

image

the thermometer, with the interval between these points being divided into ‘degrees’. In the first thermometer, made by Celsius, the fixed points chosen were the temperature of melting ice (0°C) and that of boiling water at standard atmospheric pressure (100°C), in each case the blank stem being marked at the liquid level. The distance between these two points, called the fundamental interval, was divided into 100 equal parts, each equivalent to 1°C, thus forming the scale.

The clinical thermometer, with a limited scale around body temperature, the maximum and/or minimum thermometer, recording the maximum day temperature and minimum night temperature, and the Beckman thermometer, which is used only in accurate measurement of temperature change and has no fixed points, are particular types of liquid-in-glass thermometer which all operate on the same principle.

Advantages

The liquid-in-glass thermometer is simple in construction, relatively inex- pensive, easy to use and portable, and is the most widely used method of temperature measurement having industrial, chemical, clinical and meteoro- logical applications.

Disadvantages

Liquid-in-glass thermometers tend to be fragile and hence easily broken, can only be used where the liquid column is visible, cannot be used for surface temperature measurements, cannot be read from a distance and are unsuitable for high temperature measurements.

Advantages of mercury

The use of mercury in a thermometer has many advantages, for mercury:

(i) is clearly visible,

(ii) has a fairly uniform rate of expansion,

(iii) is readily obtainable in the pure state,

(iv) does not ‘wet’ the glass,

(v) is a good conductor of heat.

Mercury has a freezing point of Ð39°C and cannot be used in a thermometer below this temperature. Its boiling point is 357°C but before this temperature is reached some distillation of the mercury occurs if the space above the mercury is a vacuum. To prevent this, and to extend the upper temperature limits to over 500°C, an inert gas such as nitrogen under pressure is used to fill the remainder of the capillary tube. Alcohol, often dyed red to be seen in the capillary tube, is considerably cheaper than mercury and has a freezing point of Ð113°C, which is considerably lower than for mercury. However it has a low boiling point at about 79°C.

Errors

Typical errors in liquid-in-glass thermometers may occur due to:

(i) the slow cooling rate of glass,

(ii) incorrect positioning of the thermometer,

(iii) a delay in the thermometer becoming steady (i.e. slow response time),

(iv) non-uniformity of the bore of the capillary tube, which means that equal intervals marked on the stem do not correspond to equal temperature intervals.

Thermocouples

Thermocouples use the e.m.f. set up when the junction of two dissimilar metals is heated.

Principle of operation

At the junction between two different metals, say, copper and constantan, there exists a difference in electrical potential, which varies with the temperature of the junction. This is known as the ‘thermo-electric effect’. If the circuit is completed with a second junction at a different temperature, a current will flow round the circuit. This principle is used in the thermocouple. Two different metal conductors having their ends twisted together are shown in Figure 31.2. If the two junctions are at different temperatures, a current I flows round the circuit.

The deflection on the galvanometer G depends on the difference in tem- perature between junctions X and Y and is caused by the difference between voltagesVx and Vy . The higher temperature junction is usually called the ‘hot junction’ and the lower temperature junction the ‘cold junction’. If the cold junction is kept at a constant known temperature, the galvanometer can be calibrated to indicate the temperature of the hot junction directly. The cold junction is then known as the reference junction.

In many instrumentation situations, the measuring instrument needs to be located far from the point at which the measurements are to be made. Extension leads are then used, usually made of the same material as the thermocouple but of smaller gauge. The reference junction is then effectively moved to their ends. The thermocouple is used by positioning the hot junction where the temperature is required. The meter will indicate the temperature of the hot junction only if the reference junction is at 0°C for:

image

In a laboratory the reference junction is often placed in melting ice, but in industry it is often positioned in a thermostatically controlled oven or buried underground where the temperature is constant.

Construction

Thermocouple junctions are made by twisting together two wires of dissimilar metals before welding them. The construction of a typical copper-constantan thermocouple for industrial use is shown in Figure 31.3. Apart from the actual
image

junction the two conductors used must be insulated electrically from each other with appropriate insulation and is shown in Figure 31.3 as twin-holed tubing. The wires and insulation are usually inserted into a sheath for protection from environments in which they might be damaged or corroded.

Applications

A copper-constantan thermocouple can measure temperature from Ð250° C up to about 400° C, and is used typically with boiler flue gases, food processing and with sub-zero temperature measurement. An iron-constantan thermocouple can measure temperature from Ð200°C to about 850°C, and is used typically in paper and pulp mills, re-heat and annealing furnaces and in chemical reactors. A chromel-alumel thermocouple can measure temperatures from Ð200° C to about 1100° C and is used typically with blast furnace gases, brick kilns and in glass manufacture. For the measurement of temperatures above 1100° C radiation pyrometers are normally used. However, thermocouples are available made of platinum-platinum/rhodium, capable of measuring temperatures up to 1400° C, or tungsten-molybdenum which can measure up to 2600° C.

Advantages

A thermocouple:

(i) has a very simple, relatively inexpensive construction,

(ii) can be made very small and compact,

(iii) is robust,

(iv) is easily replaced if damaged,

(v) has a small response time,

(vi) can be used at a distance from the actual measuring instrument and is thus ideal for use with automatic and remote-control systems.

Sources of error

Sources of error in the thermocouple that are difficult to overcome include:

(i) voltage drops in leads and junctions,

(ii) possible variations in the temperature of the cold junction,

(iii) stray thermoelectric effects, which are caused by the addition of further metals into the ’ideal’ two-metal thermocouple circuit. Additional leads are frequently necessary for extension leads or voltmeter terminal connections.

A thermocouple may be used with a battery- or mains-operated electronic thermometer instead of a millivoltmeter. These devices amplify the small e.m.f.’s from the thermocouple before feeding them to a multi-range voltmeter calibrated directly with temperature scales. These devices have great accuracy and are almost unaffected by voltage drops in the leads and junctions.

Resistance Thermometers

Resistance thermometers use the change in electrical resistance caused by temperature change.

Construction

Resistance thermometers are made in a variety of sizes, shapes and forms depending on the application for which they are designed. A typical resistance thermometer is shown diagrammatically in Figure 31.4. The most common metal used for the coil in such thermometers is platinum even though its sensitivity is not as high as other metals such as copper and nickel. However, platinum is a very stable metal and provides reproducible results in a resistance thermometer. A platinum resistance thermometer is often used as a calibrat- ing device. Since platinum is expensive, connecting leads of another metal, usually copper, are used with the thermometer to connect it to a measuring circuit. The platinum and the connecting leads are shown joined at A and B in Figure 31.4, although sometimes this junction may be made outside of the sheath. However, these leads often come into close contact with the heat source that can introduce errors into the measurements. Including a pair of identical leads, called dummy leads, which experience the same temperature change as the extension leads, may eliminate these.

Principle of operation

With most metals a rise in temperature causes an increase in electrical resistance, and since resistance can be measured accurately this property can be

image

used to measure temperature. If the resistance of a length of wire at 0°C is R0, and its resistance at e°C is Re , then Re D R0(1 C ˛e), where ˛ is the temperature coefficient of resistance of the material (see Chapter 41).

image

Values of R0 and ˛ may be determined experimentally or obtained from existing data. Thus, if Re can be measured, temperature e can be calculated. This is the principle of operation of a resistance thermometer. Although a sensitive ohmmeter can be used to measure Re , for more accurate determi- nations a Wheatstone bridge circuit is used as shown in Figure 31.5 (see also chapter 50). This circuit compares an unknown resistance Re with others of known values, R1 and R2 being fixed values and R3 being variable. Gal- vanometer G is a sensitive centre-zero microammeter. R3 is varied until zero deflection is obtained on the galvanometer, i.e. no current flows through G and the bridge is said to be ‘balanced’.

image

and if R1 and R2 are of equal value, then Re D R3

A resistance thermometer may be connected between points A and B in Figure 31.5 and its resistance Re at any temperature e accurately measured. Dummy leads included in arm BC help to eliminate errors caused by the extension leads which are normally necessary in such a thermometer.

image

Limitations

Resistance thermometers using a nickel coil are used mainly in the range Ð100°C to 300°C, whereas platinum resistance thermometers are capable of measuring with greater accuracy temperatures in the range Ð200°C to about 800° C. This upper range may be extended to about 1500° C if high melting point materials are used for the sheath and coil construction.

Advantages and disadvantages of a platinum coil

Platinum is commonly used in resistance thermometers since it is chemically inert, i.e. unreactive, resists corrosion and oxidation and has a high melting point of 1769° C. A disadvantage of platinum is its slow response to temperature variation.

Applications

Platinum resistance thermometers may be used as calibrating devices or in applications such as heat-treating and annealing processes and can be adapted easily for use with automatic recording or control systems. Resistance thermometers tend to be fragile and easily damaged especially when subjected to excessive vibration or shock.

Thermistors

A thermistor is a semi-conducting material — such as mixtures of oxides of copper, manganese, cobalt, etc. — in the form of a fused bead connected to two leads. As its temperature is increased its resistance rapidly decreases. Typical resistance/temperature curves for a thermistor and common metals are shown in Figure 31.6. The resistance of a typical thermistor can vary from 400 ˇ at 0°C to 100 ˇ at 140°C

Advantages

The main advantages of a thermistor are its high sensitivity and small size. It provides an inexpensive method of measuring and detecting small changes in temperature.

Pyrometers

A pyrometer is a device for measuring very high temperatures and uses the principle that all substances emit radiant energy when hot, the rate of emission depending on their temperature. The measurement of thermal radiation is there- fore a convenient method of determining the temperature of hot sources and is particularly useful in industrial processes. There are two main types of pyrometer, namely the total radiation pyrometer and the optical pyrometer.

image

Pyrometers are very convenient instruments since they can be used at a safe and comfortable distance from the hot source. Thus applications of pyrometers are found in measuring the temperature of molten metals, the inte- riors of furnaces or the interiors of volcanoes. Total radiation pyrometers can also be used in conjunction with devices which record and control temperature continuously.

Total radiation pyrometer

A typical arrangement of a total radiation pyrometer is shown in Figure 31.7. Radiant energy from a hot source, such as a furnace, is focused on to the hot junction of a thermocouple after reflection from a concave mirror. The temperature rise recorded by the thermocouple depends on the amount of radiant energy received, which in turn depends on the temperature of the hot source. The galvanometer G shown connected to the thermocouple records the
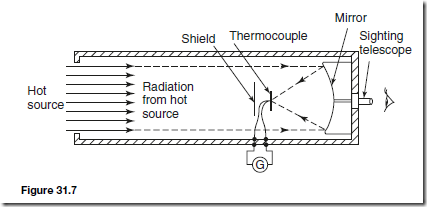
image

current that results from the e.m.f. developed and may be calibrated to give a direct reading of the temperature of the hot source. The thermocouple is protected from direct radiation by a shield as shown and the hot source may be viewed through the sighting telescope. For greater sensitivity, a thermopile may be used, a thermopile being a number of thermocouples connected in series. Total radiation pyrometers are used to measure temperature in the range 700° C to 2000° C

Optical pyrometers

When the temperature of an object is raised sufficiently two visual effects occur; the object appears brighter and there is a change in colour of the light emitted. These effects are used in the optical pyrometer where a comparison or matching is made between the brightness of the glowing hot source and the light from a filament of known temperature.

The most frequently used optical pyrometer is the disappearing filament pyrometer and a typical arrangement is shown in Figure 31.8. A filament lamp is built into a telescope arrangement that receives radiation from a hot source, an image of which is seen through an eyepiece. A red filter is incorporated as a protection to the eye.

A variable resistor controls the current flowing through the lamp. As the current is increased the temperature of the filament increases and its colour changes. When viewed through the eyepiece the filament of the lamp appears superimposed on the image of the radiant energy from the hot source. The current is varied until the filament glows as brightly as the background. It will then merge into the background and seem to disappear. The current required to achieve this is a measure of the temperature of the hot source and the ammeter can be calibrated to read the temperature directly. Optical pyrometers may be used to measure temperatures up to, and even in excess of, 3000° C

Advantages of pyrometers

(i) There is no practical limit to the temperature that a pyrometer can mea- sure.

image

(ii) A pyrometer need not be brought directly into the hot zone and so is free from the effects of heat and chemical attack that can often cause other measuring devices to deteriorate in use.

(iii) Very fast rates of change of temperature can be followed by a pyrometer.

(iv) The temperature of moving bodies can be measured.

(v) The lens system makes the pyrometer virtually independent of its distance from the source.

Disadvantages of pyrometers

(i) A pyrometer is often more expensive than other temperature measuring devices.

(ii) A direct view of the heat process is necessary.

(iii) Manual adjustment is necessary.

(iv) A reasonable amount of skill and care is required in calibrating and using a pyrometer. For each new measuring situation the pyrometer must be re-calibrated.

(v) The temperature of the surroundings may affect the reading of the pyrometer and such errors are difficult to eliminate.

Temperature Indicating Paints and Crayons

Temperature indicating paints contain substances that change their colour when heated to certain temperatures. This change is usually due to chemical decomposition, such as loss of water, in which the change in colour of the paint after having reached the particular temperature will be a permanent one. However, in some types the original colour returns after cooling. Temperature indicating paints are used where the temperature of inaccessible parts of apparatus and machines is required. They are particularly useful in heat-treatment processes where the temperature of the component needs to be known before a quenching operation. There are several such paints available and most have only a small temperature range so that different paints have to be used for different temperatures. The usual range of temperatures covered by these paints is from about 30°C to 700° C.

Temperature sensitive crayons consist of fusible solids compressed into the form of a stick. The melting point of such crayons is used to determine when a

given temperature has been reached. The crayons are simple to use but indicate a single temperature only, i.e. its melting point temperature. There are over 100 different crayons available, each covering a particular range of temperature. Crayons are available for temperatures within the range of 50°C to 1400° C.

Such crayons are used in metallurgical applications such as preheating before welding, hardening, annealing or tempering, or in monitoring the temperature of critical parts of machines or for checking mould temperatures in the rubber and plastics industries.

Bimetallic thermometers

Bimetallic thermometers depend on the expansion of metal strips that operate an indicating pointer. Two thin metal strips of differing thermal expansion are welded or riveted together and the curvature of the bimetallic strip changes with temperature change. For greater sensitivity the strips may be coiled into a flat spiral or helix, one end being fixed and the other being made to rotate a pointer over a scale. Bimetallic thermometers are useful for alarm and over- temperature applications where extreme accuracy is not essential. If the whole is placed in a sheath, protection from corrosive environments is achieved but with a reduction in response characteristics. The normal upper limit of temperature measurement by this thermometer is about 200°C, although with special metals the range can be extended to about 400°C.

Mercury-in-steel Thermometer

The mercury-in-steel thermometer is an extension of the principle of the mercury-in-glass thermometer. Mercury in a steel bulb expands via a small bore capillary tube into a pressure indicating device, say a Bourdon gauge, the position of the pointer indicating the amount of expansion and thus the temperature. The advantages of this instrument are that it is robust and, by increasing the length of the capillary tube, the gauge can be placed some distance from the bulb and can thus be used to monitor temperatures in positions that are inaccessible to the liquid-in-glass thermometer. Such thermometers may be used to measure temperatures up to 600°C.

Gas Thermometers

The gas thermometer consists of a flexible U-tube of mercury connected by a capillary tube to a vessel containing gas. The change in the volume of a fixed mass of gas at constant pressure, or the change in pressure of a fixed mass of gas at constant volume, may be used to measure temperature. This thermometer is cumbersome and rarely used to measure temperature directly, but it is often used as a standard with which to calibrate other types of thermometer. With pure hydrogen the range of the instrument extends from Ð240°C to 1500° C and measurements can be made with extreme accuracy.


The Measurement of Temperature

The Measurement of Temperature

Introduction

A change in temperature of a substance can often result in a change in one or more of its physical properties. Thus, although temperature cannot be measured directly, its effects can be measured. Some properties of substances used to determine changes in temperature include changes in dimensions, electrical resistance, state, type and volume of radiation, and colour.

Temperature measuring devices available are many and varied. Those described in the following paragraphs are those most often used in science and industry.

Liquid-in-glass Thermometer

A liquid-in-glass thermometer uses the expansion of a liquid with increase in temperature as its principle of operation.

Construction

A typical liquid-in-glass thermometer is shown in Figure 31.1 and consists of a sealed stem of uniform small-bore tubing, called a capillary tube, made of glass, with a cylindrical glass bulb formed at one end. The bulb and part of the stem are filled with a liquid such as mercury or alcohol and the remaining part of the tube is evacuated. Etching graduations on the stem forms a temperature scale. A safety reservoir is usually provided, into which the liquid can expand without bursting the glass if the temperature is raised beyond the upper limit of the scale.

Principle of operation

The operation of a liquid-in-glass thermometer depends on the liquid expand- ing with increase in temperature and contracting with decrease in temperature. The position of the end of the column of liquid in the tube is a measure of the temperature of the liquid in the bulb — shown as 15°C in Figure 31.1, which is about room temperature. Two fixed points are needed to calibrate

image

the thermometer, with the interval between these points being divided into ‘degrees’. In the first thermometer, made by Celsius, the fixed points chosen were the temperature of melting ice (0°C) and that of boiling water at standard atmospheric pressure (100°C), in each case the blank stem being marked at the liquid level. The distance between these two points, called the fundamental interval, was divided into 100 equal parts, each equivalent to 1°C, thus forming the scale.

The clinical thermometer, with a limited scale around body temperature, the maximum and/or minimum thermometer, recording the maximum day temperature and minimum night temperature, and the Beckman thermometer, which is used only in accurate measurement of temperature change and has no fixed points, are particular types of liquid-in-glass thermometer which all operate on the same principle.

Advantages

The liquid-in-glass thermometer is simple in construction, relatively inex- pensive, easy to use and portable, and is the most widely used method of temperature measurement having industrial, chemical, clinical and meteoro- logical applications.

Disadvantages

Liquid-in-glass thermometers tend to be fragile and hence easily broken, can only be used where the liquid column is visible, cannot be used for surface temperature measurements, cannot be read from a distance and are unsuitable for high temperature measurements.

Advantages of mercury

The use of mercury in a thermometer has many advantages, for mercury:

(i) is clearly visible,

(ii) has a fairly uniform rate of expansion,

(iii) is readily obtainable in the pure state,

(iv) does not ‘wet’ the glass,

(v) is a good conductor of heat.

Mercury has a freezing point of Ð39°C and cannot be used in a thermometer below this temperature. Its boiling point is 357°C but before this temperature is reached some distillation of the mercury occurs if the space above the mercury is a vacuum. To prevent this, and to extend the upper temperature limits to over 500°C, an inert gas such as nitrogen under pressure is used to fill the remainder of the capillary tube. Alcohol, often dyed red to be seen in the capillary tube, is considerably cheaper than mercury and has a freezing point of Ð113°C, which is considerably lower than for mercury. However it has a low boiling point at about 79°C.

Errors

Typical errors in liquid-in-glass thermometers may occur due to:

(i) the slow cooling rate of glass,

(ii) incorrect positioning of the thermometer,

(iii) a delay in the thermometer becoming steady (i.e. slow response time),

(iv) non-uniformity of the bore of the capillary tube, which means that equal intervals marked on the stem do not correspond to equal temperature intervals.

Thermocouples

Thermocouples use the e.m.f. set up when the junction of two dissimilar metals is heated.

Principle of operation

At the junction between two different metals, say, copper and constantan, there exists a difference in electrical potential, which varies with the temperature of the junction. This is known as the ‘thermo-electric effect’. If the circuit is completed with a second junction at a different temperature, a current will flow round the circuit. This principle is used in the thermocouple. Two different metal conductors having their ends twisted together are shown in Figure 31.2. If the two junctions are at different temperatures, a current I flows round the circuit.

The deflection on the galvanometer G depends on the difference in tem- perature between junctions X and Y and is caused by the difference between voltagesVx and Vy . The higher temperature junction is usually called the ‘hot junction’ and the lower temperature junction the ‘cold junction’. If the cold junction is kept at a constant known temperature, the galvanometer can be calibrated to indicate the temperature of the hot junction directly. The cold junction is then known as the reference junction.

In many instrumentation situations, the measuring instrument needs to be located far from the point at which the measurements are to be made. Extension leads are then used, usually made of the same material as the thermocouple but of smaller gauge. The reference junction is then effectively moved to their ends. The thermocouple is used by positioning the hot junction where the temperature is required. The meter will indicate the temperature of the hot junction only if the reference junction is at 0°C for:

image

In a laboratory the reference junction is often placed in melting ice, but in industry it is often positioned in a thermostatically controlled oven or buried underground where the temperature is constant.

Construction

Thermocouple junctions are made by twisting together two wires of dissimilar metals before welding them. The construction of a typical copper-constantan thermocouple for industrial use is shown in Figure 31.3. Apart from the actual

image

junction the two conductors used must be insulated electrically from each other with appropriate insulation and is shown in Figure 31.3 as twin-holed tubing. The wires and insulation are usually inserted into a sheath for protection from environments in which they might be damaged or corroded.

Applications

A copper-constantan thermocouple can measure temperature from Ð250° C up to about 400° C, and is used typically with boiler flue gases, food processing and with sub-zero temperature measurement. An iron-constantan thermocouple can measure temperature from Ð200°C to about 850°C, and is used typically in paper and pulp mills, re-heat and annealing furnaces and in chemical reactors. A chromel-alumel thermocouple can measure temperatures from Ð200° C to about 1100° C and is used typically with blast furnace gases, brick kilns and in glass manufacture. For the measurement of temperatures above 1100° C radiation pyrometers are normally used. However, thermocouples are available made of platinum-platinum/rhodium, capable of measuring temperatures up to 1400° C, or tungsten-molybdenum which can measure up to 2600° C.

Advantages

A thermocouple:

(i) has a very simple, relatively inexpensive construction,

(ii) can be made very small and compact,

(iii) is robust,

(iv) is easily replaced if damaged,

(v) has a small response time,

(vi) can be used at a distance from the actual measuring instrument and is thus ideal for use with automatic and remote-control systems.

Sources of error

Sources of error in the thermocouple that are difficult to overcome include:

(i) voltage drops in leads and junctions,

(ii) possible variations in the temperature of the cold junction,

(iii) stray thermoelectric effects, which are caused by the addition of further metals into the ’ideal’ two-metal thermocouple circuit. Additional leads are frequently necessary for extension leads or voltmeter terminal connections.

A thermocouple may be used with a battery- or mains-operated electronic thermometer instead of a millivoltmeter. These devices amplify the small e.m.f.’s from the thermocouple before feeding them to a multi-range voltmeter calibrated directly with temperature scales. These devices have great accuracy and are almost unaffected by voltage drops in the leads and junctions.

Resistance Thermometers

Resistance thermometers use the change in electrical resistance caused by temperature change.

Construction

Resistance thermometers are made in a variety of sizes, shapes and forms depending on the application for which they are designed. A typical resistance thermometer is shown diagrammatically in Figure 31.4. The most common metal used for the coil in such thermometers is platinum even though its sensitivity is not as high as other metals such as copper and nickel. However, platinum is a very stable metal and provides reproducible results in a resistance thermometer. A platinum resistance thermometer is often used as a calibrat- ing device. Since platinum is expensive, connecting leads of another metal, usually copper, are used with the thermometer to connect it to a measuring circuit. The platinum and the connecting leads are shown joined at A and B in Figure 31.4, although sometimes this junction may be made outside of the sheath. However, these leads often come into close contact with the heat source that can introduce errors into the measurements. Including a pair of identical leads, called dummy leads, which experience the same temperature change as the extension leads, may eliminate these.

Principle of operation

With most metals a rise in temperature causes an increase in electrical resistance, and since resistance can be measured accurately this property can be

image

used to measure temperature. If the resistance of a length of wire at 0°C is R0, and its resistance at e°C is Re , then Re D R0(1 C ˛e), where ˛ is the temperature coefficient of resistance of the material (see Chapter 41).

image

Values of R0 and ˛ may be determined experimentally or obtained from existing data. Thus, if Re can be measured, temperature e can be calculated. This is the principle of operation of a resistance thermometer. Although a sensitive ohmmeter can be used to measure Re , for more accurate determi- nations a Wheatstone bridge circuit is used as shown in Figure 31.5 (see also chapter 50). This circuit compares an unknown resistance Re with others of known values, R1 and R2 being fixed values and R3 being variable. Gal- vanometer G is a sensitive centre-zero microammeter. R3 is varied until zero deflection is obtained on the galvanometer, i.e. no current flows through G and the bridge is said to be ‘balanced’.

image

and if R1 and R2 are of equal value, then Re D R3

A resistance thermometer may be connected between points A and B in Figure 31.5 and its resistance Re at any temperature e accurately measured. Dummy leads included in arm BC help to eliminate errors caused by the extension leads which are normally necessary in such a thermometer.

image

Limitations

Resistance thermometers using a nickel coil are used mainly in the range Ð100°C to 300°C, whereas platinum resistance thermometers are capable of measuring with greater accuracy temperatures in the range Ð200°C to about 800° C. This upper range may be extended to about 1500° C if high melting point materials are used for the sheath and coil construction.

Advantages and disadvantages of a platinum coil

Platinum is commonly used in resistance thermometers since it is chemically inert, i.e. unreactive, resists corrosion and oxidation and has a high melting point of 1769° C. A disadvantage of platinum is its slow response to temperature variation.

Applications

Platinum resistance thermometers may be used as calibrating devices or in applications such as heat-treating and annealing processes and can be adapted easily for use with automatic recording or control systems. Resistance thermometers tend to be fragile and easily damaged especially when subjected to excessive vibration or shock.

Thermistors

A thermistor is a semi-conducting material — such as mixtures of oxides of copper, manganese, cobalt, etc. — in the form of a fused bead connected to two leads. As its temperature is increased its resistance rapidly decreases. Typical resistance/temperature curves for a thermistor and common metals are shown in Figure 31.6. The resistance of a typical thermistor can vary from 400 ˇ at 0°C to 100 ˇ at 140°C

Advantages

The main advantages of a thermistor are its high sensitivity and small size. It provides an inexpensive method of measuring and detecting small changes in temperature.

Pyrometers

A pyrometer is a device for measuring very high temperatures and uses the principle that all substances emit radiant energy when hot, the rate of emission depending on their temperature. The measurement of thermal radiation is there- fore a convenient method of determining the temperature of hot sources and is particularly useful in industrial processes. There are two main types of pyrometer, namely the total radiation pyrometer and the optical pyrometer.

image

Pyrometers are very convenient instruments since they can be used at a safe and comfortable distance from the hot source. Thus applications of pyrometers are found in measuring the temperature of molten metals, the inte- riors of furnaces or the interiors of volcanoes. Total radiation pyrometers can also be used in conjunction with devices which record and control temperature continuously.

Total radiation pyrometer

A typical arrangement of a total radiation pyrometer is shown in Figure 31.7. Radiant energy from a hot source, such as a furnace, is focused on to the hot junction of a thermocouple after reflection from a concave mirror. The temperature rise recorded by the thermocouple depends on the amount of radiant energy received, which in turn depends on the temperature of the hot source. The galvanometer G shown connected to the thermocouple records the

image

current that results from the e.m.f. developed and may be calibrated to give a direct reading of the temperature of the hot source. The thermocouple is protected from direct radiation by a shield as shown and the hot source may be viewed through the sighting telescope. For greater sensitivity, a thermopile may be used, a thermopile being a number of thermocouples connected in series. Total radiation pyrometers are used to measure temperature in the range 700° C to 2000° C

Optical pyrometers

When the temperature of an object is raised sufficiently two visual effects occur; the object appears brighter and there is a change in colour of the light emitted. These effects are used in the optical pyrometer where a comparison or matching is made between the brightness of the glowing hot source and the light from a filament of known temperature.

The most frequently used optical pyrometer is the disappearing filament pyrometer and a typical arrangement is shown in Figure 31.8. A filament lamp is built into a telescope arrangement that receives radiation from a hot source, an image of which is seen through an eyepiece. A red filter is incorporated as a protection to the eye.

A variable resistor controls the current flowing through the lamp. As the current is increased the temperature of the filament increases and its colour changes. When viewed through the eyepiece the filament of the lamp appears superimposed on the image of the radiant energy from the hot source. The current is varied until the filament glows as brightly as the background. It will then merge into the background and seem to disappear. The current required to achieve this is a measure of the temperature of the hot source and the ammeter can be calibrated to read the temperature directly. Optical pyrometers may be used to measure temperatures up to, and even in excess of, 3000° C

Advantages of pyrometers

(i) There is no practical limit to the temperature that a pyrometer can mea- sure.

image

(ii) A pyrometer need not be brought directly into the hot zone and so is free from the effects of heat and chemical attack that can often cause other measuring devices to deteriorate in use.

(iii) Very fast rates of change of temperature can be followed by a pyrometer.

(iv) The temperature of moving bodies can be measured.

(v) The lens system makes the pyrometer virtually independent of its distance from the source.

Disadvantages of pyrometers

(i) A pyrometer is often more expensive than other temperature measuring devices.

(ii) A direct view of the heat process is necessary.

(iii) Manual adjustment is necessary.

(iv) A reasonable amount of skill and care is required in calibrating and using a pyrometer. For each new measuring situation the pyrometer must be re-calibrated.

(v) The temperature of the surroundings may affect the reading of the pyrometer and such errors are difficult to eliminate.

Temperature Indicating Paints and Crayons

Temperature indicating paints contain substances that change their colour when heated to certain temperatures. This change is usually due to chemical decomposition, such as loss of water, in which the change in colour of the paint after having reached the particular temperature will be a permanent one. However, in some types the original colour returns after cooling. Temperature indicating paints are used where the temperature of inaccessible parts of apparatus and machines is required. They are particularly useful in heat-treatment processes where the temperature of the component needs to be known before a quenching operation. There are several such paints available and most have only a small temperature range so that different paints have to be used for different temperatures. The usual range of temperatures covered by these paints is from about 30°C to 700° C.

Temperature sensitive crayons consist of fusible solids compressed into the form of a stick. The melting point of such crayons is used to determine when a

given temperature has been reached. The crayons are simple to use but indicate a single temperature only, i.e. its melting point temperature. There are over 100 different crayons available, each covering a particular range of temperature. Crayons are available for temperatures within the range of 50°C to 1400° C.

Such crayons are used in metallurgical applications such as preheating before welding, hardening, annealing or tempering, or in monitoring the temperature of critical parts of machines or for checking mould temperatures in the rubber and plastics industries.

Bimetallic thermometers

Bimetallic thermometers depend on the expansion of metal strips that operate an indicating pointer. Two thin metal strips of differing thermal expansion are welded or riveted together and the curvature of the bimetallic strip changes with temperature change. For greater sensitivity the strips may be coiled into a flat spiral or helix, one end being fixed and the other being made to rotate a pointer over a scale. Bimetallic thermometers are useful for alarm and over- temperature applications where extreme accuracy is not essential. If the whole is placed in a sheath, protection from corrosive environments is achieved but with a reduction in response characteristics. The normal upper limit of temperature measurement by this thermometer is about 200°C, although with special metals the range can be extended to about 400°C.

Mercury-in-steel Thermometer

The mercury-in-steel thermometer is an extension of the principle of the mercury-in-glass thermometer. Mercury in a steel bulb expands via a small bore capillary tube into a pressure indicating device, say a Bourdon gauge, the position of the pointer indicating the amount of expansion and thus the temperature. The advantages of this instrument are that it is robust and, by increasing the length of the capillary tube, the gauge can be placed some distance from the bulb and can thus be used to monitor temperatures in positions that are inaccessible to the liquid-in-glass thermometer. Such thermometers may be used to measure temperatures up to 600°C.

Gas Thermometers

The gas thermometer consists of a flexible U-tube of mercury connected by a capillary tube to a vessel containing gas. The change in the volume of a fixed mass of gas at constant pressure, or the change in pressure of a fixed mass of gas at constant volume, may be used to measure temperature. This thermometer is cumbersome and rarely used to measure temperature directly, but it is often used as a standard with which to calibrate other types of thermometer. With pure hydrogen the range of the instrument extends from Ð240°C to 1500° C and measurements can be made with extreme accuracy.


Thermal Expansion

Thermal Expansion

Introduction

When heat is applied to most materials, expansion occurs in all directions. Conversely, if heat energy is removed from a material (i.e. the material is cooled) contraction occurs in all directions. The effects of expansion and contraction each depend on the change of temperature of the material.

Practical Applications of Thermal Expansion

Some practical applications where expansion and contraction of solid materials must be allowed for include:

(i) Overhead electrical transmission lines are hung so that they are slack in summer, otherwise their contraction in winter may snap the conductors or bring down pylons.

(ii) Gaps need to be left in lengths of railway lines to prevent buckling in hot weather (except where these are continuously welded).

(iii) Ends of large bridges are often supported on rollers to allow them to expand and contract freely.

(iv) Fitting a metal collar to a shaft or a steel tyre to a wheel is often achieved by first heating them so that they expand, fitting them in position, and then cooling them so that the contraction holds them firmly in place; this is known as a ‘shrink-fit’. By a similar method hot rivets are used for joining metal sheets.

(v) The amount of expansion varies with different materials. Figure 30.1(a) shows a bimetallic strip at room temperature (i.e. two different strips of metal riveted together). When heated, brass expands more than steel, and since the two metals are riveted together the bimetallic strip is forced into an arc as shown in Figure 30.1(b). Such a movement can be arranged to make or break an electric circuit and bimetallic strips are used, in particular, in thermostats (which are temperature-operated switches) used to control central heating systems, cookers, refrigerators, toasters, irons, hot water and alarm systems.

(vi) Motor engines use the rapid expansion of heated gases to force a piston to move.

(vii) Designers must predict, and allow for, the expansion of steel pipes in a steam-raising plant so as to avoid damage and consequent danger to health.

Expansion and Contraction of Water

Water is a liquid that at low temperature displays an unusual effect. If cooled, contraction occurs until, at about 4°C, the volume is at a minimum. As the

image

temperature is further decreased from 4°C to 0°C expansion occurs, i.e. the volume increases. When ice is formed, considerable expansion occurs and it is this expansion that often causes frozen water pipes to burst.

A practical application of the expansion of a liquid is with thermometers, where the expansion of a liquid, such as mercury or alcohol, is used to measure temperature.

Coefficient of Linear Expansion

The amount by which unit length of a material expands when the temperature is raised one degree is called the coefficient of linear expansion of the material and is represented by ˛ (Greek alpha).

The units of the coefficient of linear expansion are m/(mK), although it is usually quoted as just /K or KÐ1. For example, copper has a coefficient of linear expansion value of 17 ð 10Ð6 KÐ1, which means that a 1 m long bar of copper expands by 0.000017 m if its temperature is increased by 1 K (or 1°C). If a 6 m long bar of copper is subjected to a temperature rise of 25 K then the bar will expand by (6 ð 0.000017 ð 25) m, i.e. 0.00255 m or 2.55 mm. (Since the kelvin scale uses the same temperature interval as the Celsius scale, a change of temperature of, say, 50°C, is the same as a change of temperature of 50 K).

If a material, initially of length l1 and at a temperature of t1 and having a coefficient of linear expansion ˛, has its temperature increased to t2, then the new length l2 of the material is given by:

image

For example, the copper tubes in a boiler are 4.20 m long at a temperature of 20°C. Then, when surrounded only by feed water at 10°C, the final length of the tubes, l2, is given by:

image

Coefficient of Superficial Expansion

The amount by which unit area of a material increases when the temperature is raised by one degree is called the coefficient of superficial (i.e. area) expansion and is represented by ˇ (Greek beta).

If a material having an initial surface area A1 at temperature t1 and having a coefficient of superficial expansion ˇ, has its temperature increased to t2, then the new surface area A2 of the material is given by:

image

It may be shown that the coefficient of superficial expansion is twice the coefficient of linear expansion, i.e. ˇ D 2˛, to a very close approximation.

Coefficient of Cubic Expansion

The amount by which unit volume of a material increases for a one degree rise of temperature is called the coefficient of cubic (or volumetric) expansion and is represented by y (Greek gamma).

If a material having an initial volume V1 at temperature t1 and having a coefficient of cubic expansion y, has its temperature raised to t2, then the new volume V2 of the material is given by:

image

It may be shown that the coefficient of cubic expansion is three times the coefficient of linear expansion, i.e. y D 3˛, to a very close approximation.

A liquid has no definite shape and only its cubic or volumetric expansion need be considered. Thus with expansions in liquids, equation (3) is used.

Some typical values for the coefficient of cubic expansion measured at 20°C

(i.e. 293 K) include:

image