Capacitors and RC Time Constants : Dielectric characteristics , Capacitance formulas and Capacitors in parallel.

DIELECTRIC CHARACTERISTICS

Three factors were shown to affect the capacitance of a capacitor. One factor is the type of insulating material used for the dielectric. Most capacitors are constructed using a dielectric material having a higher dielectric constant than air.

The dielectric constant of an insulating material measures the effectiveness of the material when it is used as the dielectric of a capacitor. It is assumed that air has a dielectric constant of one. If a two-plate capacitor has a dielectric consisting of paper impregnated

image

with paraffin, rather than a dielectric of air, the capacitance will increase. If the capacitance is doubled when using paper in place of air for the dielectric, the dielectric constant for paper is 2. This value indicates the degree of distortion of the electron orbits in the dielectric for a given applied voltage. Table 5–1 lists the dielectric constants of some insulating materials.

Dielectric Strength

If the voltage across the plates of a capacitor becomes too high, the dielectric may be burned or punctured by the high potential. That is, the high potential tears electrons from the orbits of the atoms of the dielectric material. As a result, the dielectric becomes a con- ducting material, resulting in permanent damage to the dielectric.

Dielectric materials are given a dielectric strength rating. This rating is stated as either “volts per centimeter” or “volts per mil” of thickness required to break down the dielectric. The dielectric strength rating is not the same as the dielectric constant rating. For example, the dielectric constant of paper is about 2 and that of Pyrex glass is approximately 4. However, the dielectric strength in volts per mil for some kinds of paper is about 1200 V. For Pyrex glass, the dielectric strength is only 325 V per mil.

CAPACITANCE FORMULAS

The capacitance of a two-plate capacitor is directly proportional to the area of one plate and inversely proportional to the distance of separation between the plates.

This statement can be expressed as a formula. Actually, there are two forms of the formula, depending on the units of measurement for the distances involved. To determine the capacitance in picofarads when the plate dimensions and the distance between the plates are given in inches, the formula is

image

PROBLEM 1

Statement of the Problem

A paper capacitor consists of two tinfoil plates, each 8 feet (ft) long and 1 inch (in.) wide. The waxed paper that separates the two plates has a thickness of 0.05 in. Determine the capacitance of the capacitor. The dielectric constant of waxed paper is 2.

Solution

image

CAPACITORS IN PARALLEL

In addition to increasing the plate area, an increase in capacitance can be obtained by increasing the number of plates in the capacitor.

The multiple plates of the capacitor shown in Figure 5–7 are placed so that a maxi- mum plate area is obtained. Note that alternate plates are connected in parallel. To calculate

image

the capacitance of a multiplate capacitor, where the plates are identical and are separated by the same distance, the following expression is used:

image

image


Capacitors and RC Time Constants : Capacitors in series , Capacitors in network systems , Energy in a capacitor and RC time constants.

CAPACITORS IN SERIES

When capacitors are connected in series, the dielectrics of the individual capacitors are connected one after the other to form a single circuit path. This arrangement is equivalent to increasing the thickness of the dielectric of one capacitor. This means that the total capacitance of the circuit is less than the capacitance of any individual capacitor.

When capacitors are charged in a series circuit, the same number of electrons flow to each capacitor. As a result, each capacitor has the same charge (Q) in coulombs.

For example, Figure 5–9 shows three capacitors connected in series across a line volt- age (V). The capacitors have the same ratings as in Figure 5–8 for a parallel circuit. It can be shown that the total capacitance of the capacitors connected in series is less than the capacitance of any one capacitor.

The voltage across the series circuit is

image

The charge in coulombs on each capacitor is the same:

image

The formulas for total capacitance can be used only when all of the values are in the same unit of capacitance measurement, either microfarads or picofarads. If some of the capacitors in a circuit are rated in microfarads and the rest are rated in picofarads, then some values must be changed so that all of the values are expressed in the same unit of measurement before the total capacitance is found.

The total capacitance can also be determined using the product-over-sum formula:

image

In the example above, three capacitors having values of 30 p,F, 10 p,F, and 15 p,F are connected in series. The total capacitance can be determined by substituting two values at a time and then using that answer with the next capacitance value:

image

This procedure can be followed until all series capacitance values have been employed.

A third formula for determining the total capacitance of capacitors connected in series can be used only when all the capacitance values are the same. Assume that four capacitors, each having a value of 60 p,F, are connected in series. The total capacitance can be determined by dividing the capacitance value of one capacitor by the number of capacitors.

image

CAPACITORS IN NETWORK SYSTEMS

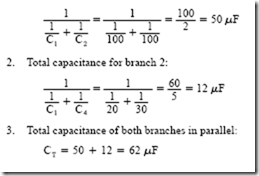
Capacitors can also be connected in network systems where the total capacitance must be determined. Figure 5–10 shows two capacitor network systems. To obtain the total capacitance of the capacitor network system in Figure 5–10A, the following procedure is used:

1. Total capacitance for branch 1:

image

image

ENERGY IN A CAPACITOR

It was shown at the beginning of this unit that a capacitor will store electrical energy. The amount of energy stored in a capacitor, in joules or watt-seconds, can be determined as follows:


image

Thus, one-half the charge in coulombs times the charging potential in volts yields the energy in joules stored in the capacitor. Recall that Q = C X V. Therefore, C X V may be substituted for Q in the previous formula with the result that

image

For example, a 50-p,F capacitor is connected across a 300-V dc source. It is required to find the energy in watt-seconds stored in this capacitor:

image

RC TIME CONSTANTS

Direct Current Fundamentals showed that the intensity of electron flow per second in amperes is expressed by amperes = coulombs divided by seconds (I = Q/t). Also, the quantity of electrons in coulombs is given by coulombs = amperes times seconds (Q = I X t). For a capacitor, the charge in coulombs on the plates is a function of the intensity of current (amperes) and the time (seconds) of charging. As the value of the current increases, less time is required to charge the capacitor fully.

Recall that the voltage across the plates of a capacitor equals the line voltage when the capacitor is fully charged. The charging time for a given capacitor depends on the charging current. Thus, the time required for a given voltage to build up across the capacitor can be controlled by increasing or decreasing the charging current. The charging cur- rent can be controlled by placing a series assembly of a resistor and a capacitor across the charging potential. In other words, this current controls the time that must elapse before a given voltage exists across the capacitor terminals.

Charging the Capacitor

The circuit shown in Figure 5–11A consists of a 50-p,F capacitor connected in series with a resistor across a 300-V dc supply. In Figure 5–11B, the resistor consists of a dc voltmeter having a scale range of 300 V and a resistance of 1000 D/V. Thus, the resistance of this voltmeter is 300,000 D. At the instant the circuit is energized, the voltmeter needle swings to a full-scale reading. Such a value indicates that all of the line voltage is across the terminals of the voltmeter. (This voltmeter acts like a 300,000-D series resistor.) The voltage across the capacitor at this same instant is zero.

The equation for the voltage in the series circuit in Figure 5–11B is

image

image

where VC is the voltage across the capacitor and VV is the voltage across the voltmeter. The applied voltage (V) is constant. This means that as the voltage across the capacitor (V ) increases, the voltage across the voltmeter (V ) must decrease. As the voltage across the capacitor approaches the applied voltage (V), the current in the circuit approaches zero. In effect, the voltage across the capacitor is a backward voltage that reduces the current flow. As the current approaches zero, the voltage across the voltmeter approaches zero.

Plotting the Charging of the Capacitor. A curve can be plotted of the rising voltage across the capacitor plates. For the circuit of Figure 5–11B, voltmeter readings are taken at 15-s intervals. In each case, the reading is subtracted from the fixed line voltage (V). As a result, the voltage across the plates of the capacitor can be determined as the capacitor charges. Table 5–2 lists the voltage across the capacitor plates at 15-s intervals, as obtained by this method. At zero seconds, note that the capacitor is completely discharged. At the end of 75 s, the voltage across the capacitor plates has almost reached the value of the line voltage.

Drawing the Exponential Charging Curve. The data in Table 5–2 are plotted in Figure 5–12 to form a curve of the rising voltage across the capacitor plates for the interval of 75 s.

Note in the figure that the horizontal axis of the curve is marked both in time constants and time in seconds. The term time constant is defined as follows:

One time constant is the time, in seconds, required for a completely discharged capacitor to charge to 63.2% of the source voltage. This charging time is equal to the product of the resistance in ohms and the capacitance in farads:

image

Refer to Figure 5–12 and note that the 15-s mark on the horizontal scale corresponds to the mark for one time constant. From the definition of a time constant, the voltage across the capacitor plates in an RC series circuit is 63.2% of the impressed voltage at the end of one time constant. For this circuit, then, the voltage across the capacitor plates at the end of one time constant is 300 X 0.632 = 189 V.

Formula for an Exponential Curve. The curve shown in Figure 5–12 is known as an exponential curve. The voltage curve for a series RC circuit is expressed by the following mathematical formula

image

The quantity (1 ET /RC) is called an exponential operator and is considered to be an operator on the voltage (V).

The formula for V may be used to find the percentage of the impressed voltage on the capacitor plates at the end of one time constant, two time constants, or any desired number of time constants. For example, the percentage of the impressed voltage on the capacitor

image

This calculation shows that the voltage across the capacitor plates at the end of one time constant is equal to 63.2% of the impressed voltage. For the RC series circuit of Figure 5–11, the actual voltage on the capacitor plates at the end of one time constant is

image

Recall that this same value was determined graphically in Figure 5–12. To find the percentage of the impressed voltage across the capacitor plates at the end of two time constants, the calculations are as follows:

image

In this problem, the exponent T/RC is equal to two (two time constants are involved).

A number with a negative exponent is the same as the reciprocal of that number to the given power. Because E-2 is the same as 1 ÷ 2.7182, we obtain

image

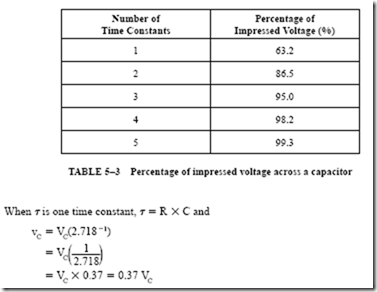
These calculations can be repeated for any number of time constants. The resulting percentages are given in Table 5–3 for five time constants.

Based on the information given in Table 5–3, it is assumed that the capacitor is fully charged at the end of five time constants.

Discharging the Capacitor

When a capacitor is discharged through a resistor, the amount of time required depends on the value of the resistor. The 50-p,F capacitor shown in Figure 5–13 is assumed to be completely charged at 300 V. This capacitor is to be discharged through the 300,000-D resistance of a voltmeter.

As a capacitor discharges through a resistor during one time constant, the volt- age across the capacitor decreases to 37% of its value when the capacitor was fully charged. To determine capacitor voltages on discharge, the following exponential formula is used

image

image

Plotting the Voltage Curve for a Capacitor on Discharge. Assume that the fully charged capacitor has a potential difference of 300 V across its terminals. When the capacitor is discharged, the voltage across the terminals at the end of one time constant is

image

This calculation can be repeated for any number of time constants. The results are summarized in Table 5–4, which lists the percentage of voltage on the plates of a discharging capacitor for each of five time constants.

By plotting the values given in Table 5–4, an exponential voltage curve is obtained for the discharge of the 50-p,F capacitor connected across the 300,000-D voltmeter (Figure 5–14). The voltmeter serves as the discharge resistor. It also measures the decreasing voltage across the capacitor plates. The curve shows that the capacitor voltage decreases from 300 V

image

image

to a value near zero. Table 5–5 shows the percentage of voltage and the actual voltage during the capacitor discharge for each of five time constants.

Current Relationships of a Capacitor

The study of RC circuits to this point has been based on the voltage relationships across the terminals of a capacitor. However, it is also important to study the current relationships for a capacitor when it is charging and discharging.

When a completely discharged capacitor is connected in series with a current-lim- iting resistor across a dc source, the initial current at the instant the circuit is energized is determined by I = V –: R. The capacitor dielectric offers no opposition to the current when the capacitor is discharged. As the charge on the capacitor plates increases, a volt- age develops.

This voltage increases with time, as shown in Figure 5–12, until its value is equal to the line voltage. As the voltage increases, the current decreases following an exponential curve. When the voltage across the capacitor plates equals the line voltage, the charging current becomes zero.

If the same capacitor is discharged through a resistor, the direction of electron flow is reversed. At the instant the fully charged capacitor is connected to the resistor, the initial current is equal to V –: R. As the voltage across the capacitor terminals decreases following an exponential curve, the current also decreases in a similar manner.

Charge and Discharge Curves. Figure 5–15 shows the charge and discharge curves for current and voltage for an RC circuit. During charging, the charge current decreases as the potential across the capacitor plates increases. Both curves follow an exponential pattern. When the capacitor is discharged, the current decreases exponentially from its initial value to zero. The curve for the current on discharge is below the zero reference line defined by Ohm’s law. This location means that the direction of current in the circuit is reversed when the capacitor is discharging. Note that the discharging voltage curve looks like the charging current curve. Likewise, the discharging current curve looks like the charging voltage curve.

image

At the beginning of either a charge period or a discharge period, the initial current is given by Ohm’s law. To find the current after a given number of time periods, for either charge or discharge, a modified form of Ohm’s law is required.

image

PROBLEM 2

Statement of the Problem

Refer to the RC circuit shown in Figure 5–11. Determine

1. the initial charge current at the instant the circuit is energized.

2. the current at the end of one time constant.

Solution

1. At the instant the circuit is energized, the charging current is limited by the resistance of the voltmeter alone. The initial current is

image

image


Series Circuits—Resistance and Impedance : Resistance and inductance in series.

RESISTANCE AND INDUCTANCE IN SERIES

Unit 3 discussed series circuits containing only resistance and pure inductance. It is not possible for a circuit to have pure inductance because the coils of inductive equipment all have resistance. To obtain high values of inductance, iron cores are usually required. However, eddy currents and hysteresis losses in iron cores increase the ac resistance considerably. This effective resistance must be considered in all problems involving inductance. The discussion in this section will be confined to the study of circuits with resistance and inductance in series. The impedance section of each circuit considered consists of a reactor having a relatively large inductive reactance compared to the effective resistance.

Vector Resolution

The solution of most of the following problems uses a method called vector resolution. This method is widely used and its application should be clear to the student.

image

image

PROBLEM 1

Statement of the Problem

Figure 4–7 shows a reactor connected directly across a 120-V, 60-Hz source. Meter readings for the line voltage, current, and power are shown on the circuit diagram. The impedance of the coil is the result of the combination of the effective resistance and inductive reactance. The impedance can be determined by considering the coil as a series circuit with a resistance component and an inductive reactance component.

The ohmic values of the reactor coil are determined as follows:

• Impedance of coil:

image

3. The current, in amperes

4. The true power, in watts, taken by

a. the resistor

b. the coil

c. the entire series circuit

5. The apparent power in volt-amperes taken by the entire series circuit

6. The power factor of

a. the coil

b. the entire series circuit

Then construct a vector diagram for the series circuit.

Solution

1. The total resistance of the series circuit is obtained by adding the resistance values. The resistor value is 36 n. The effective resistance, determined earlier, is 4 n. Therefore, the total resistance is

R = 36 + 4 = 40 n

2. The inductive reactance of the entire series circuit is contained in the reactor coil.

When the reactor was connected across a 60-Hz source, its inductive reactance was  29.8 n. The total resistance of the series circuit is 40 n. Thus, the total series circuit impedance is

image

4. a. The true power taken by the resistor rated at 36 n is

P = I2R = 52 X 36 = 25 X 36 = 900 W

b. The true power expended in the coil is

P = I2R = 52 X 4 = 25 X 4 = 100 W

c. The total true power for the entire series circuit can be obtained by adding the power expended in the resistor and the reactor. The formula I2R can also be used to find the total true power. R is the total effective resistance of the series circuit: .

image

The value 0.1333 is the cosine of an angle that is equal to 82.3°. Thus, the reactor current lags the impressed voltage across the reactor by 82.3°.

b. The power factor of the entire series circuit is the ratio of the total true power in watts to the total apparent power in volt-amperes. The power factor of the circuit is also the ratio of the total series circuit resistance to the total circuit impedance:

image

image

The angle for a cosine value of 0.8000 is 36.9°. This means that the line current lags the line voltage by 36.9°.

7. Figure 4–9 shows one method of constructing the vector diagram for this series circuit. The line current, 5 A, is drawn as a horizontal line. A convenient scale is used. V , the component of the reactor voltage caused by the effective resistance of the coil, is placed directly on the current line. V  is drawn from point 0 along the current line  and has a magnitude of 20 V. The voltage drop across the 36-n resistor is 180 V. This value is added to the 20-V drop on the current vector. The total voltage drop caused by resistance in the series circuit is 200 V in phase with the current. The voltage component caused by inductive reactance in the reactor is drawn in a vertical direction from point 0. This component, VXL  is at an angle of 90° with the current. The current lags  the voltage loss, caused by the inductive reactance, by an angle of 90°. The two voltage components of the reactor can be added vectorially to obtain the reactor voltage.

In Figure 4–9, the voltage across the reactor is shown as the vector sum of the two voltage components of the coil. These components are caused by the effective resistance and the inductive reactance. The phase angle between the voltage across the reactor and the current is 82.3°. This angle is indicated by the small Greek letter alpha (a). Note the right triangle formed by VXL and Vcoil.

Vector addition is used to find the sum of the total voltage drop due to the resistance in the circuit and the voltage drop due to inductive reactance. This vector sum is the line voltage. The angle e between the line voltage and the current is 36.9°, lagging.

Figure 4–10 shows a second method of constructing a vector diagram for the same series circuit. In this figure, the voltage drops are arranged differently because of the two resistance components of the series circuit. This change in placement on the current vector of the two resistance voltage losses means that the voltage components for the reactor must also be shown in a location different from that in Figure 4–9.

Although the two vector diagrams are drawn differently, the magnitude and phase relationships of all voltages, in reference to the current, are exactly the same. Therefore, either vector diagram may be used to analyze a series circuit containing R and Z components.

PROBLEM 2

Statement of the Problem

Figure 4–11 shows a noninductive heater unit connected in series with a reactor. The reactor controls the current in the series circuit. This means that the reactor also controls the temperature of the heater unit. The wattmeter indicates the total true power in watts taken by the circuit.

1. Determine the series circuit power factor and the phase angle.

2. Determine the true power, in watts, taken by the noninductive heating load.

image

3. Determine the loss in watts in the coil.

4. Determine the effective resistance of the coil.

5. What is the power factor and angle of lag for the coil?

6. Determine the inductance, in henrys, of the coil at the circuit frequency of 25 Hz.

7. Draw a vector diagram, an impedance triangle, and a triangle of power values. Each diagram is to be drawn to scale and properly labeled.

Solution

1. The total true power taken by the circuit is 1650 W. The power factor is the ratio of the total true power in watts to the total apparent power in volt-amperes:

image

The angle of lag of the line current behind the line voltage is 41.4°.

2. The true power in watts taken by the heater unit is the product of the voltage across the heater unit and the current. These two values are in phase:

P = VR X I = 150 X 10 = 1500 W

image

5. The impedance of the reactor must be determined before the power factor for the reactor can be found. The effective resistance of the reactor was determined in step 4. Thus, the power factor for the reactor can be determined by the ratio R/Z:

image

The angle of lag of the current behind the reactor voltage is 84.1°.

6. The inductance of the reactor can be obtained once the inductive reactance is known. The effective resistance and the impedance of the coil were calculated in steps 4 and 5, respectively. The inductive reactance is given by the expression

image

Figure 4–12 shows the impedance triangle, the triangle of power values, and the vector diagram. A study of the three diagrams shows that they are similar right triangles.


Inductance in Alternating-Current Circuits : Vector addition and subtraction , Resistance and inductive reactance in series and Power and power factor.

VECTOR ADDITION AND SUBTRACTION

The use of vectors simplifies the analysis of circuit conditions. The student should have a basic working understanding of vector diagrams and how they can aid in the solution of circuit problems.

Many physical quantities, such as cubic inches, pounds, minutes, and degrees, are expressed in specific units. These quantities do not contain a direction. Such units of measurement are known as scalar quantities when using vector terminology. A scalar unit is defined in terms of its magnitude only. Many quantities relating to electric circuits do not have magnitude alone, but also have direction. Any quantity having both manitude and direction is called a vector. Examples of vectors include feet per second in a northeast direction, volts at 0°, and miles in a southerly direction. In electrical problems, rotating vectors are used to represent effective values of sinusoidal current and voltage in angular relationship to each other. According to convention, these vectors are rotated counterclockwise.

image

Basic Rules of Vectors

There are some basic rules of vector addition and subtraction that are used throughout the text. The student must understand these and other basic vector concepts before any attempt can be made to solve vector diagrams.

Figure 3–9 shows vectors of a unit length in different quadrants. Each vector is labeled to indicate the head and the tail. This notation will not be carried throughout the text.

The following simple explanation of vector addition yields some basic rules that can be applied to more complicated problems. It is assumed that two people, A and B, exert a force of 6 lb and 4 lb, respectively, on a pole in the positive x direction. The total force exerted is 10 lb in the positive x direction. Figure 3–10 shows how these forces are arranged in a vector diagram. The relationship of these vectors is shown by the expression

image

The arrow above the V indicates a vector quantity. R is called the resultant of the two vectors. For this example, the resultant is 10 lb.

To add vectors, place the head of either vector to the tail of the other vector and measure or calculate the resultant from start to finish.

image

Applications of Vector Addition

The basic rule of vector addition can be applied to vector combinations that are not in a straight line (Figure 3–11). For each part of Figure 3–11, vector V is added to vector V ,  or vector V A B is added to vector V .

For each of the diagrams, the angles are measured from the positive X axis. Angles  a and {3 in Figure 3–11C make the figure look more complicated than it really is.

image

The measurement of these angles ensures that vectors V and V are moved parallel to their original positions.

The addition of vectors in a straight line is the same as the arithmetic sum of their scalar values. Vectors that are not in a straight line require a geometric solution. Such vectors are not the sum of their scalar values.

Subtraction of Vectors

Examples of vector subtraction are shown in Figure 3–12. The vector to be subtracted is reversed and is then added head to tail to the remaining vector.

The resultants in Figure 3–12 are all equal in magnitude. However, the resultants in parts B and C of the figure differ in direction by 180° from the resultants in parts D and E. It can be said that their scalar values are equal but their directions are different.

The information presented in Unit 1 on angular relationships could just as well have used the term rotating vector (or phasor) in place of rotating line.

image

RESISTANCE AND INDUCTIVE REACTANCE IN SERIES

Unit 2 described circuits containing resistance only. The first part of this unit covered inductance, inductive reactance, and the voltage and current relationships in ac circuits containing inductance only. This background makes it possible to analyze more practical circuits containing resistance and inductive reactance in series.

To show the application of vector diagrams to ac circuits, two simple examples will be discussed. The first example is an ac circuit with a noninductive load, where the current and voltage are in phase. The second example is a circuit containing only inductance, with the current lagging behind the impressed voltage by 90°.

The circuit shown in Figure 3–13 was used in Unit 2. This circuit consists of a 100-0 noninductive heater unit with an effective line potential of 100 V. An effective cur- rent of one ampere is in phase with the voltage. The sine-wave patterns for the voltage and current for this circuit were developed in Unit 2. The student should recall that the first step was to determine the instantaneous voltage and current values at fixed increments in electrical time degrees. Then the sinusoidal wave patterns were plotted.

Diagrams for the Heater Current

The noninductive heater circuit has the sine-wave patterns shown in Figure 3–13. The vector diagram for this same circuit is also shown. The starting point of the vector diagram is marked “0.” The V and I vectors are assumed to rotate counterclockwise around point 0. Line V represents the effective line voltage of 100 V. This line is drawn to a convenient scale. Line I is the vector representing the current of one ampere. This vector is placed directly on the voltage vector to indicate that it is in phase with the voltage. The lengths of the vectors in vector diagrams represent effective values of current and voltage. (Note that I and V both begin at 0; V is not added to I and is shown as having a greater magnitude.)

Current is constant in a series circuit. Thus, all angles are measured with respect to the current vector, making it a reference vector.

image

image

Earlier in this unit, an inductor coil was used to show the effect of inductive reactance (XL) of 100 0 and was connected across an effective potential of 100 V. The effective cur- rent for this circuit was one ampere. The current lagged the voltage by 90°. For this circuit, the inductive reactive circuit, the sinusoidal wave patterns for the voltage and current, and the vector diagram are shown in Figure 3–14.

Refer to the vector diagram in Figure 3–14. The line current is drawn horizontally from point 0. Because the voltage leads the current by 90 electrical time degrees, the volt- age vector must be drawn so that it is ahead of I by 90°. Vectors V and I are assumed to rotate counterclockwise. Thus, the voltage vector must point upward from 0. The angle between it and the current vector is 90°.

The angle by which the current lags behind the line voltage is called the phase angle or angle theta, abbreviated Lθ.

The series circuit shown in Figure 3–15 consists of a noninductive heater unit with a resistance of 20 0. The circuit also has an inductor coil with an inductive reactance (XL)

image

of 15 0. The coil is connected across a line potential of 125 V at a frequency of 60 Hz. The current in this circuit is limited in value by the resistance in ohms and the inductive reactance in ohms. Previously, it was shown that in a resistive circuit, the current is in phase with the voltage. In a circuit with inductive reactance, the current lags behind the voltage by 90°. There is both resistance and inductive reactance in the series circuit in Figure 3–15. For this circuit, the following quantities are to be found:

1. Voltage loss across the resistor

2. Voltage loss across the inductor coil

3. Line voltage

4. Impedance in ohms

5. True power in watts

6. Reactive power in VARs (volt-amperes-reactive)

7. Apparent power in volt-amperes

8. Power factor

Voltage Loss across R and XL

The current in the circuit of Figure 3–15 is 5 A. Because this is a series circuit, the current is 5 A at all points in the series path. The voltage loss across the noninductive resistor will be in phase with the current. This loss is determined by using Ohm’s law as follows:

image

The voltage loss across the inductor coil leads the current by 90°. In other words, the current lags the voltage across the inductor coil by 90°. Ohm’s law is also used in this instance to determine the voltage loss across the inductor coil:

image

If the two voltage drops across the R and X components of the series circuit are added algebraically, the sum is 175 V. This value obviously does not represent the line voltage. The reason for this error is that the two voltage drops are 90 electrical degrees out of phase with each other. This means that the line voltage is the vector sum of the two voltage drops, or

image

Vector Diagram of a Series Circuit

When a vector diagram is developed for a series circuit, it must be remembered that the current is the same at all points in the circuit. Therefore, the current is used as a reference line. In Figure 3–16, the 5-A current is drawn as a horizontal reference vector, using a workable scale.

image

The voltage loss across the resistance (VR ) is placed on the current vector because both vectors are in phase. The voltage loss across the inductor coil is drawn in a vertical direction from point 0. This voltage (VL ) leads the current by 90°. The resultant voltage is the vector sum of the two voltage drops, which are 90° out of phase.

The vector diagram shows that the line voltage is the hypotenuse of a right triangle. The hypotenuse of a right triangle is equal to the square root of the sum of the squares of the other two sides. Therefore, the line voltage for the series circuit is

image

This voltage value can be checked against Figure 3–15 to ensure that it is equal to the line voltage. The 125-V line voltage causes a current of 5 A in the series circuit, which consists of resistance and inductive reactance. Each ohmic value limits the current. The combined effect of resistance and inductive reactance is called impedance and is represented by the letter Z.

Impedance is the resulting value in ohms of the combination of resistance and reactance.

The Impedance Triangle

A triangle known as an impedance triangle is obtained by dividing the voltage triangle by a constant reference vector I (Figure 3–17). Several equations can be written by inspecting the right triangles in Figure 3–17:

image

To find the line current in ac series circuits, Ohm’s law is used as follows:

image

image

POWER AND POWER FACTOR

Several formulas for power can be written by inspecting the triangles in Figure 3–18. The impedance and voltage formulas were covered earlier in this unit.

image

By applying the basic principles of similar triangles and the Pythagorean theorem to the triangles in Figure 3–18, seven more formulas are derived. For the circuit of Figure 3–15, the apparent power, in volt-amperes, is

V X I = 125 X 5 = 625 volt-amperes

Determining True Power

In the noninductive circuit analyzed in Unit 2, the effective voltage and the effective current in amperes were in phase. The product of these values gave the power in watts taken by the circuit. The first part of the present unit deals with a circuit consisting of pure inductive reactance. In this circuit, the current lags the voltage by 90°. In a circuit with pure inductive reactance, the actual true power in watts is zero and is not the product of the volts and amperes. In a series circuit containing both inductive reactance and resistance (Figure 3–15), the current is neither in phase with the line voltage nor lagging 90° behind

the line voltage. The angle of lag for a circuit containing both R and XL will be somewhere between these two limits. Power will be taken by the circuit.

How is the true power in watts determined? One way is to use the formula W = I2R. The actual power used in the resistance of any ac circuit is equal to the square of the effective current multiplied by the resistance in ohms.

Actual watts = I2 X R = 52 X 20 = 500 W used in the resistance of  the circuit in Figure 3–15  The power taken by this circuit can also be found by multiplying the voltage loss across the resistance section of the circuit by the current. Because the current and voltage are in phase, their product is the true average power:

Watts = VR X I = 100 X 5 =500 W used in the resistance of the circuit

Note that the true power in watts is the same using either method. Recall from Direct Current Fundamentals that electricity is a form of pure energy. Watts is a measure of the amount of electrical energy converted to some other form. When current flows through the resistive part of any circuit, electrical energy is converted into thermal energy in the form of heat.

Reactive Power

In addition to the true power used in the resistance, there is another power component to be considered. This component is called reactive power and is expressed in a unit called volt-amperes-reactive. This unit is usually shown in the abbreviated form “VARs.” It rep- resents the product of volts and amperes that are 90° out of phase with each other.

Figure 3–8 shows a graph of reactive power over one cycle. The total net true power in watts is zero for one cycle because the two negative power pulses cancel the two positive power pulses. As a result, the descriptive term wattless power is sometimes applied to this power component in an ac circuit. The correct terminology for this power component is quadrature power or reactive power. In the series circuit in Figure 3–15, the voltage drop across the component with pure inductive reactance is 75 V. Therefore, the quadrature power in VARs is the product of the voltage across the reactance and

the current. These values are 90° out of phase. This quadrature, reactive, or wattless power is

VARs = VL X I = 75 X 5 = 375 VARs

To better understand wattless power or VARs, consider that true power or watts can be produced only when electrical energy is converted to some other form. When the alternating-current waveform flowing through an inductor increases in value, it causes a magnetic field to be produced around the inductor (Figure 3–19). Energy is required to create or establish the magnetic field. When the alternating-current wave- form begins to decrease in value, the field collapses and returns the energy to the circuit. In the case of an inductor, electrical energy is stored in the form of a magnetic field and then returned to the circuit. The electrical energy is not changed to some other form.

The true power in watts is used in the resistance of the circuit. The quadrature power is identified with the reactance of the circuit. The combination of the two power components yields a resultant called the apparent power in volt-amperes. This resultant in volt-amperes can be regarded as the hypotenuse of a power triangle, as shown in Figure 3–18.

image

Power Factor

Power factor (PF) is defined as the ratio between the true power in watts and the apparent power in volt-amperes. The power factor may be expressed as a decimal value or as a percentage:

image

Unit 4 will present a thorough study of alternating-current resistance. This quantity is more properly called effective resistance. More realistic series circuits consisting of resistance and impedance components will be analyzed using the formulas derived in this unit.

SUMMARY

• The induced voltage of a conductor, coil, or circuit is caused by a changing magnetic field cutting across the circuit components. This voltage is proportional to the rate of change of the lines of force.

• In a dc circuit, the inductive effect stops once the current reaches the value defined by Ohm’s law and remains constant.

• Lenz’s law states that in all cases of electromagnetic induction, the induced voltage and the resultant current are in a direction that opposes the effect that produces them.

• Induction in an electrical circuit can be called electrical inertia.

• In a circuit containing inductance, current will increase at a much slower rate toward a maximum value than it does in a circuit containing resistance only.

• The length of time required for the current to decay to zero, once the circuit is deenergized, equals the time required for the current to rise to its Ohm’s law value when the inductive circuit is energized.

• Inductance is the ability of a circuit component, such as a reactor coil, to store energy in the electromagnetic field.

• The unit of inductance is the henry. A circuit or circuit component is said to have an inductance of one henry when a current change of one ampere per second induces a voltage of one volt.

• In an ac circuit with the same effective voltage as an equivalent dc circuit, the circuit current will be less than in the dc circuit because of the choking effect of inductance in the ac circuit.

• The induced voltage or counterelectromagnetic voltage in a series inductive circuit opposes the impressed voltage and thus limits the circuit current.

• Removing the laminated iron core from a coil in an ac circuit will decrease the inductive reactance in the circuit. In effect, the circuit current is increased.

• Increasing the frequency of an ac inductive series circuit decreases the circuit current.

• Inductance in an ac circuit is just as effective in limiting current as resistance.

Inductive reactance is the opposition in an ac circuit due to inductance.

image

where w is the Greek letter omega and represents angular velocity; 2’ITf also is equal to angular velocity.

4. An accepted value for 2’ITf is 377, when the frequency is 60 Hz. For 25 Hz, 2’ITf = 157.

5. Ohm’s law for inductive reactance is

image

• The angle by which the current lags behind the line voltage is called the phase angle or

angle theta, abbreviated L8.

1. In a` pure inductive circuit, the current lags the voltage by 90°.

2. In a circuit containing both resistance and inductive reactance, the angle of lag is less than 90° and is equal to the vectorial sum of both the X components.

• A scalar is a measure of a specific unit of quantity [such as 6 inches (in.) or 5 pounds (lb)]. It has magnitude but does not show any direction.

• A vector is any quantity having both magnitude and direction.

• According to convention, vectors are rotated counterclockwise.

• To add vectors, place the head of either vector to the tail of the other vector and measure or calculate the resultant from start to finish.

1. Vectors in a straight line can be added by taking the arithmetic sum of their scalar values.

2. Vectors not in a straight line require a geometric solution and are not the sum of their scalar values.

• To subtract vectors, the vector to be subtracted is reversed and is then added head to tail to the remaining vector.

• All angles are measured with respect to the current vector as the reference vector, because current is constant in a series circuit.

• The actual power (true power) in watts taken by a pure inductive circuit is zero.

1. The two positive pulses of power (when power is taken from the supply) are equal to the two negative pulses of power (when power is returned to the supply from the magnetic field). The net power taken by the inductor coil in one complete cycle is zero.

2. True power is equal to I2 R.

[Note: The product of the effective voltage and the effective current may not equal the power in watts in any circuit containing inductive reactance.]

image

image

clip_image002[1]_thumbclip_image002[2]_thumb
Achievement Review

1. State Lenz’s law.

2. Define the standard unit of measurement of inductance.

3. What is meant by inductive reactance?

4. Add the following vectors (show the vector diagram for each addition):

a. 208 V at 90° and 120 V at 180°

b. 50 V at 0° and 42.1 V at 270°

c. 20.3 V at 0° and 8.2 V at 0°

d. 46.2 V at 0°, 71.4 V at 90°, and 38 V at 0°

5. Subtract the following vectors (show the vector diagram for each subtraction):

a. 208 V at 90° from 120 V at 180°

b. 50 V at 0° from 42.1 V at 270°

c. 20.3 V at 0° from 8.2 V at 0°

d. 84.2 V at 0° from 71.4 V at 90°

6. Resolve a voltage of 48 V into two coordinates, one of which is 23.2 V.

7. A line voltage (V) of 100 V is at an angle of 45° with respect to the line current. Find the horizontal component (V ) and the vertical component (V ) of the applied voltage.

8. An inductor coil with an inductance of 0.5 H and negligible resistance is connected across the terminals of a 230-V, 60-Hz supply.

a. Determine the current in amperes taken by the inductor coil.

b. What power in watts is taken by this inductor coil if the current lags the impressed voltage by 90 electrical degrees?

9. a. If the inductor coil in question 8 is connected across the terminals of a 230-V, 25-Hz supply, what is the current in amperes?

b. Explain the reason for any change in current as the frequency changes.

10. An inductor coil connected across a 120-V, 60-Hz supply takes 10 A. The resistance of the inductor coil can be neglected. Determine

a. the inductive reactance of the coil.

b. the inductance of the coil.

11. An ac motor takes 10 A when connected across a 240-V, 60-Hz source. A wattmeter connected in the circuit reads 1500 W. Determine

a. the power factor of the motor.

b. the angle of lag of the current behind the voltage for the motor circuit.

12. An industrial load connected to a 440-V, 60-Hz line takes 50 A. The current lags the voltage by 30 electrical degrees.

a. What is the power factor of this circuit?

b. Determine

1. the apparent power, in volt-amperes.

2. the true power, in watts.

13. A series circuit (Figure 3–20) consists of resistance and inductive reactance connected in series across a 150-V, 60-Hz source. The resistance component of the series circuit consists of six 60-W, 120-V lamps, connected in parallel. Each lamp has a hot resistance of 240 0. The inductive reactive part of the series circuit consists of an inductor coil with an inductive reactance of 30 0 and negligible resistance. Determine

a. the impedance of the series circuit.

b. the current, in amperes.

c. the inductance of the inductor coil, in henrys.

image


14. For the circuit in question 13, determine

a. the voltage loss across the bank of lamps.

b. the voltage drop across the inductor coil.

c. the true power in watts taken by the circuit.

d. the reactive power in VARs taken by the circuit.

15. a. For the circuit in question 13, determine the power factor.

b. What is the angle of lag or the power factor angle?

16. The following diagrams are to be drawn to scale for the circuit in question 13:

a. A voltage vector diagram

b. An impedance triangle

c. A triangle of power components

17. A 30-0 resistor and a reactor coil (inductor coil) with a 0.2-H inductance and negligible resistance are connected in series across a 120-V, 25-Hz supply. Determine

a. the impedance of the circuit.

b. the current.

c. the true power in watts taken by the circuit.

d. the power factor.

e. the phase angle.

18. Draw a vector diagram for the circuit in question 17. The vectors must be drawn accurately to a convenient scale. Mark each vector with the proper letter identification.

19. A reactor coil that has negligible resistance is connected in series with a group of incandescent lamps connected in parallel. The purpose of the reactor coil is to reduce the voltage across the lamps. When the circuit is energized from a 120-V, 60-Hz source, the current in the reactor coil is 25 A. The voltage across the lamps is 30 V. Determine

a. the circuit impedance, in ohms.

b. the voltage loss across the reactor coil.

c. the inductive reactance of the inductor coil, in ohms.

d. the inductance of the reactor coil, in henrys.

e. the power factor and the angle of lag.

20. Using the circuit given in question 19

a. determine the power in watts used in the circuit.

b. determine the quadrature, or vertical power component, in VARs.

c. determine the apparent power, in volt-amperes.

d. draw an impedance triangle and a power triangle to scale.

e. draw a voltage vector diagram to scale.

image


Inductance in Alternating-Current Circuits : Vector addition and subtraction , Resistance and inductive reactance in series and Power and power factor.

VECTOR ADDITION AND SUBTRACTION

The use of vectors simplifies the analysis of circuit conditions. The student should have a basic working understanding of vector diagrams and how they can aid in the solution of circuit problems.

Many physical quantities, such as cubic inches, pounds, minutes, and degrees, are expressed in specific units. These quantities do not contain a direction. Such units of measurement are known as scalar quantities when using vector terminology. A scalar unit is defined in terms of its magnitude only. Many quantities relating to electric circuits do not have magnitude alone, but also have direction. Any quantity having both manitude and direction is called a vector. Examples of vectors include feet per second in a northeast direction, volts at 0°, and miles in a southerly direction. In electrical problems, rotating vectors are used to represent effective values of sinusoidal current and voltage in angular relationship to each other. According to convention, these vectors are rotated counterclockwise.

image

Basic Rules of Vectors

There are some basic rules of vector addition and subtraction that are used throughout the text. The student must understand these and other basic vector concepts before any attempt can be made to solve vector diagrams.

Figure 3–9 shows vectors of a unit length in different quadrants. Each vector is labeled to indicate the head and the tail. This notation will not be carried throughout the text.

The following simple explanation of vector addition yields some basic rules that can be applied to more complicated problems. It is assumed that two people, A and B, exert a force of 6 lb and 4 lb, respectively, on a pole in the positive x direction. The total force exerted is 10 lb in the positive x direction. Figure 3–10 shows how these forces are arranged in a vector diagram. The relationship of these vectors is shown by the expression

image

The arrow above the V indicates a vector quantity. R is called the resultant of the two vectors. For this example, the resultant is 10 lb.

To add vectors, place the head of either vector to the tail of the other vector and measure or calculate the resultant from start to finish.

image

Applications of Vector Addition

The basic rule of vector addition can be applied to vector combinations that are not in a straight line (Figure 3–11). For each part of Figure 3–11, vector V is added to vector V ,  or vector V A B is added to vector V .

For each of the diagrams, the angles are measured from the positive X axis. Angles  a and {3 in Figure 3–11C make the figure look more complicated than it really is.

image

The measurement of these angles ensures that vectors V and V are moved parallel to their original positions.

The addition of vectors in a straight line is the same as the arithmetic sum of their scalar values. Vectors that are not in a straight line require a geometric solution. Such vectors are not the sum of their scalar values.

Subtraction of Vectors

Examples of vector subtraction are shown in Figure 3–12. The vector to be subtracted is reversed and is then added head to tail to the remaining vector.

The resultants in Figure 3–12 are all equal in magnitude. However, the resultants in parts B and C of the figure differ in direction by 180° from the resultants in parts D and E. It can be said that their scalar values are equal but their directions are different.

The information presented in Unit 1 on angular relationships could just as well have used the term rotating vector (or phasor) in place of rotating line.

image

RESISTANCE AND INDUCTIVE REACTANCE IN SERIES

Unit 2 described circuits containing resistance only. The first part of this unit covered inductance, inductive reactance, and the voltage and current relationships in ac circuits containing inductance only. This background makes it possible to analyze more practical circuits containing resistance and inductive reactance in series.

To show the application of vector diagrams to ac circuits, two simple examples will be discussed. The first example is an ac circuit with a noninductive load, where the current and voltage are in phase. The second example is a circuit containing only inductance, with the current lagging behind the impressed voltage by 90°.

The circuit shown in Figure 3–13 was used in Unit 2. This circuit consists of a 100-0 noninductive heater unit with an effective line potential of 100 V. An effective cur- rent of one ampere is in phase with the voltage. The sine-wave patterns for the voltage and current for this circuit were developed in Unit 2. The student should recall that the first step was to determine the instantaneous voltage and current values at fixed increments in electrical time degrees. Then the sinusoidal wave patterns were plotted.

Diagrams for the Heater Current

The noninductive heater circuit has the sine-wave patterns shown in Figure 3–13. The vector diagram for this same circuit is also shown. The starting point of the vector diagram is marked “0.” The V and I vectors are assumed to rotate counterclockwise around point 0. Line V represents the effective line voltage of 100 V. This line is drawn to a convenient scale. Line I is the vector representing the current of one ampere. This vector is placed directly on the voltage vector to indicate that it is in phase with the voltage. The lengths of the vectors in vector diagrams represent effective values of current and voltage. (Note that I and V both begin at 0; V is not added to I and is shown as having a greater magnitude.)

Current is constant in a series circuit. Thus, all angles are measured with respect to the current vector, making it a reference vector.

image

image

Earlier in this unit, an inductor coil was used to show the effect of inductive reactance (XL) of 100 0 and was connected across an effective potential of 100 V. The effective cur- rent for this circuit was one ampere. The current lagged the voltage by 90°. For this circuit, the inductive reactive circuit, the sinusoidal wave patterns for the voltage and current, and the vector diagram are shown in Figure 3–14.

Refer to the vector diagram in Figure 3–14. The line current is drawn horizontally from point 0. Because the voltage leads the current by 90 electrical time degrees, the volt- age vector must be drawn so that it is ahead of I by 90°. Vectors V and I are assumed to rotate counterclockwise. Thus, the voltage vector must point upward from 0. The angle between it and the current vector is 90°.

The angle by which the current lags behind the line voltage is called the phase angle or angle theta, abbreviated Lθ.

The series circuit shown in Figure 3–15 consists of a noninductive heater unit with a resistance of 20 0. The circuit also has an inductor coil with an inductive reactance (XL)

image

of 15 0. The coil is connected across a line potential of 125 V at a frequency of 60 Hz. The current in this circuit is limited in value by the resistance in ohms and the inductive reactance in ohms. Previously, it was shown that in a resistive circuit, the current is in phase with the voltage. In a circuit with inductive reactance, the current lags behind the voltage by 90°. There is both resistance and inductive reactance in the series circuit in Figure 3–15. For this circuit, the following quantities are to be found:

1. Voltage loss across the resistor

2. Voltage loss across the inductor coil

3. Line voltage

4. Impedance in ohms

5. True power in watts

6. Reactive power in VARs (volt-amperes-reactive)

7. Apparent power in volt-amperes

8. Power factor

Voltage Loss across R and XL

The current in the circuit of Figure 3–15 is 5 A. Because this is a series circuit, the current is 5 A at all points in the series path. The voltage loss across the noninductive resistor will be in phase with the current. This loss is determined by using Ohm’s law as follows:

image

The voltage loss across the inductor coil leads the current by 90°. In other words, the current lags the voltage across the inductor coil by 90°. Ohm’s law is also used in this instance to determine the voltage loss across the inductor coil:

image

If the two voltage drops across the R and X components of the series circuit are added algebraically, the sum is 175 V. This value obviously does not represent the line voltage. The reason for this error is that the two voltage drops are 90 electrical degrees out of phase with each other. This means that the line voltage is the vector sum of the two voltage drops, or

image

Vector Diagram of a Series Circuit

When a vector diagram is developed for a series circuit, it must be remembered that the current is the same at all points in the circuit. Therefore, the current is used as a reference line. In Figure 3–16, the 5-A current is drawn as a horizontal reference vector, using a workable scale.

image

The voltage loss across the resistance (VR ) is placed on the current vector because both vectors are in phase. The voltage loss across the inductor coil is drawn in a vertical direction from point 0. This voltage (VL ) leads the current by 90°. The resultant voltage is the vector sum of the two voltage drops, which are 90° out of phase.

The vector diagram shows that the line voltage is the hypotenuse of a right triangle. The hypotenuse of a right triangle is equal to the square root of the sum of the squares of the other two sides. Therefore, the line voltage for the series circuit is

image

This voltage value can be checked against Figure 3–15 to ensure that it is equal to the line voltage. The 125-V line voltage causes a current of 5 A in the series circuit, which consists of resistance and inductive reactance. Each ohmic value limits the current. The combined effect of resistance and inductive reactance is called impedance and is represented by the letter Z.

Impedance is the resulting value in ohms of the combination of resistance and reactance.

The Impedance Triangle

A triangle known as an impedance triangle is obtained by dividing the voltage triangle by a constant reference vector I (Figure 3–17). Several equations can be written by inspecting the right triangles in Figure 3–17:

image

To find the line current in ac series circuits, Ohm’s law is used as follows:

image

image

POWER AND POWER FACTOR

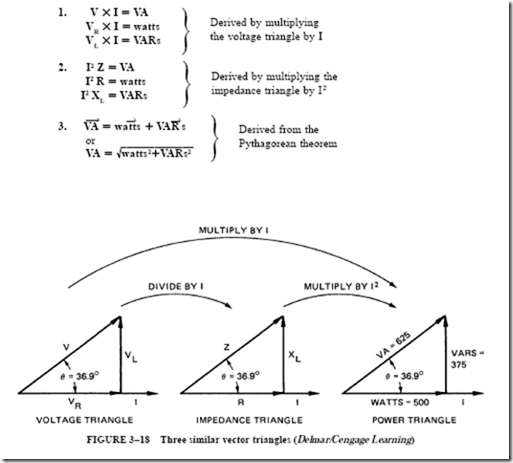
Several formulas for power can be written by inspecting the triangles in Figure 3–18. The impedance and voltage formulas were covered earlier in this unit.
image

By applying the basic principles of similar triangles and the Pythagorean theorem to the triangles in Figure 3–18, seven more formulas are derived. For the circuit of Figure 3–15, the apparent power, in volt-amperes, is

V X I = 125 X 5 = 625 volt-amperes

Determining True Power

In the noninductive circuit analyzed in Unit 2, the effective voltage and the effective current in amperes were in phase. The product of these values gave the power in watts taken by the circuit. The first part of the present unit deals with a circuit consisting of pure inductive reactance. In this circuit, the current lags the voltage by 90°. In a circuit with pure inductive reactance, the actual true power in watts is zero and is not the product of the volts and amperes. In a series circuit containing both inductive reactance and resistance (Figure 3–15), the current is neither in phase with the line voltage nor lagging 90° behind

the line voltage. The angle of lag for a circuit containing both R and XL will be somewhere between these two limits. Power will be taken by the circuit.

How is the true power in watts determined? One way is to use the formula W = I2R. The actual power used in the resistance of any ac circuit is equal to the square of the effective current multiplied by the resistance in ohms.

Actual watts = I2 X R = 52 X 20 = 500 W used in the resistance of  the circuit in Figure 3–15  The power taken by this circuit can also be found by multiplying the voltage loss across the resistance section of the circuit by the current. Because the current and voltage are in phase, their product is the true average power:

Watts = VR X I = 100 X 5 =500 W used in the resistance of the circuit

Note that the true power in watts is the same using either method. Recall from Direct Current Fundamentals that electricity is a form of pure energy. Watts is a measure of the amount of electrical energy converted to some other form. When current flows through the resistive part of any circuit, electrical energy is converted into thermal energy in the form of heat.

Reactive Power

In addition to the true power used in the resistance, there is another power component to be considered. This component is called reactive power and is expressed in a unit called volt-amperes-reactive. This unit is usually shown in the abbreviated form “VARs.” It rep- resents the product of volts and amperes that are 90° out of phase with each other.

Figure 3–8 shows a graph of reactive power over one cycle. The total net true power in watts is zero for one cycle because the two negative power pulses cancel the two positive power pulses. As a result, the descriptive term wattless power is sometimes applied to this power component in an ac circuit. The correct terminology for this power component is quadrature power or reactive power. In the series circuit in Figure 3–15, the voltage drop across the component with pure inductive reactance is 75 V. Therefore, the quadrature power in VARs is the product of the voltage across the reactance and

the current. These values are 90° out of phase. This quadrature, reactive, or wattless power is

VARs = VL X I = 75 X 5 = 375 VARs

To better understand wattless power or VARs, consider that true power or watts can be produced only when electrical energy is converted to some other form. When the alternating-current waveform flowing through an inductor increases in value, it causes a magnetic field to be produced around the inductor (Figure 3–19). Energy is required to create or establish the magnetic field. When the alternating-current wave- form begins to decrease in value, the field collapses and returns the energy to the circuit. In the case of an inductor, electrical energy is stored in the form of a magnetic field and then returned to the circuit. The electrical energy is not changed to some other form.

The true power in watts is used in the resistance of the circuit. The quadrature power is identified with the reactance of the circuit. The combination of the two power components yields a resultant called the apparent power in volt-amperes. This resultant in volt-amperes can be regarded as the hypotenuse of a power triangle, as shown in Figure 3–18.

image

Power Factor

Power factor (PF) is defined as the ratio between the true power in watts and the apparent power in volt-amperes. The power factor may be expressed as a decimal value or as a percentage:

image

Unit 4 will present a thorough study of alternating-current resistance. This quantity is more properly called effective resistance. More realistic series circuits consisting of resistance and impedance components will be analyzed using the formulas derived in this unit.

SUMMARY

• The induced voltage of a conductor, coil, or circuit is caused by a changing magnetic field cutting across the circuit components. This voltage is proportional to the rate of change of the lines of force.

• In a dc circuit, the inductive effect stops once the current reaches the value defined by Ohm’s law and remains constant.

• Lenz’s law states that in all cases of electromagnetic induction, the induced voltage and the resultant current are in a direction that opposes the effect that produces them.

• Induction in an electrical circuit can be called electrical inertia.

• In a circuit containing inductance, current will increase at a much slower rate toward a maximum value than it does in a circuit containing resistance only.

• The length of time required for the current to decay to zero, once the circuit is deenergized, equals the time required for the current to rise to its Ohm’s law value when the inductive circuit is energized.

• Inductance is the ability of a circuit component, such as a reactor coil, to store energy in the electromagnetic field.

• The unit of inductance is the henry. A circuit or circuit component is said to have an inductance of one henry when a current change of one ampere per second induces a voltage of one volt.

• In an ac circuit with the same effective voltage as an equivalent dc circuit, the circuit current will be less than in the dc circuit because of the choking effect of inductance in the ac circuit.

• The induced voltage or counterelectromagnetic voltage in a series inductive circuit opposes the impressed voltage and thus limits the circuit current.

• Removing the laminated iron core from a coil in an ac circuit will decrease the inductive reactance in the circuit. In effect, the circuit current is increased.

• Increasing the frequency of an ac inductive series circuit decreases the circuit current.

• Inductance in an ac circuit is just as effective in limiting current as resistance.

Inductive reactance is the opposition in an ac circuit due to inductance.

image

where w is the Greek letter omega and represents angular velocity; 2’ITf also is equal to angular velocity.

4. An accepted value for 2’ITf is 377, when the frequency is 60 Hz. For 25 Hz, 2’ITf = 157.

5. Ohm’s law for inductive reactance is

image

• The angle by which the current lags behind the line voltage is called the phase angle or

angle theta, abbreviated L8.

1. In a` pure inductive circuit, the current lags the voltage by 90°.

2. In a circuit containing both resistance and inductive reactance, the angle of lag is less than 90° and is equal to the vectorial sum of both the X components.

• A scalar is a measure of a specific unit of quantity [such as 6 inches (in.) or 5 pounds (lb)]. It has magnitude but does not show any direction.

• A vector is any quantity having both magnitude and direction.

• According to convention, vectors are rotated counterclockwise.

• To add vectors, place the head of either vector to the tail of the other vector and measure or calculate the resultant from start to finish.

1. Vectors in a straight line can be added by taking the arithmetic sum of their scalar values.

2. Vectors not in a straight line require a geometric solution and are not the sum of their scalar values.

• To subtract vectors, the vector to be subtracted is reversed and is then added head to tail to the remaining vector.

• All angles are measured with respect to the current vector as the reference vector, because current is constant in a series circuit.

• The actual power (true power) in watts taken by a pure inductive circuit is zero.

1. The two positive pulses of power (when power is taken from the supply) are equal to the two negative pulses of power (when power is returned to the supply from the magnetic field). The net power taken by the inductor coil in one complete cycle is zero.

2. True power is equal to I2 R.

[Note: The product of the effective voltage and the effective current may not equal the power in watts in any circuit containing inductive reactance.]

image

image

clip_image002[1]_thumbclip_image002[2]_thumb
Achievement Review

1. State Lenz’s law.

2. Define the standard unit of measurement of inductance.

3. What is meant by inductive reactance?

4. Add the following vectors (show the vector diagram for each addition):

a. 208 V at 90° and 120 V at 180°

b. 50 V at 0° and 42.1 V at 270°

c. 20.3 V at 0° and 8.2 V at 0°

d. 46.2 V at 0°, 71.4 V at 90°, and 38 V at 0°

5. Subtract the following vectors (show the vector diagram for each subtraction):

a. 208 V at 90° from 120 V at 180°

b. 50 V at 0° from 42.1 V at 270°

c. 20.3 V at 0° from 8.2 V at 0°

d. 84.2 V at 0° from 71.4 V at 90°

6. Resolve a voltage of 48 V into two coordinates, one of which is 23.2 V.

7. A line voltage (V) of 100 V is at an angle of 45° with respect to the line current. Find the horizontal component (V ) and the vertical component (V ) of the applied voltage.

8. An inductor coil with an inductance of 0.5 H and negligible resistance is connected across the terminals of a 230-V, 60-Hz supply.

a. Determine the current in amperes taken by the inductor coil.

b. What power in watts is taken by this inductor coil if the current lags the impressed voltage by 90 electrical degrees?

9. a. If the inductor coil in question 8 is connected across the terminals of a 230-V, 25-Hz supply, what is the current in amperes?

b. Explain the reason for any change in current as the frequency changes.

10. An inductor coil connected across a 120-V, 60-Hz supply takes 10 A. The resistance of the inductor coil can be neglected. Determine

a. the inductive reactance of the coil.

b. the inductance of the coil.

11. An ac motor takes 10 A when connected across a 240-V, 60-Hz source. A wattmeter connected in the circuit reads 1500 W. Determine

a. the power factor of the motor.

b. the angle of lag of the current behind the voltage for the motor circuit.

12. An industrial load connected to a 440-V, 60-Hz line takes 50 A. The current lags the voltage by 30 electrical degrees.

a. What is the power factor of this circuit?

b. Determine

1. the apparent power, in volt-amperes.

2. the true power, in watts.

13. A series circuit (Figure 3–20) consists of resistance and inductive reactance connected in series across a 150-V, 60-Hz source. The resistance component of the series circuit consists of six 60-W, 120-V lamps, connected in parallel. Each lamp has a hot resistance of 240 0. The inductive reactive part of the series circuit consists of an inductor coil with an inductive reactance of 30 0 and negligible resistance. Determine

a. the impedance of the series circuit.

b. the current, in amperes.

c. the inductance of the inductor coil, in henrys.

image


14. For the circuit in question 13, determine

a. the voltage loss across the bank of lamps.

b. the voltage drop across the inductor coil.

c. the true power in watts taken by the circuit.

d. the reactive power in VARs taken by the circuit.

15. a. For the circuit in question 13, determine the power factor.

b. What is the angle of lag or the power factor angle?

16. The following diagrams are to be drawn to scale for the circuit in question 13:

a. A voltage vector diagram

b. An impedance triangle

c. A triangle of power components

17. A 30-0 resistor and a reactor coil (inductor coil) with a 0.2-H inductance and negligible resistance are connected in series across a 120-V, 25-Hz supply. Determine

a. the impedance of the circuit.

b. the current.

c. the true power in watts taken by the circuit.

d. the power factor.

e. the phase angle.

18. Draw a vector diagram for the circuit in question 17. The vectors must be drawn accurately to a convenient scale. Mark each vector with the proper letter identification.

19. A reactor coil that has negligible resistance is connected in series with a group of incandescent lamps connected in parallel. The purpose of the reactor coil is to reduce the voltage across the lamps. When the circuit is energized from a 120-V, 60-Hz source, the current in the reactor coil is 25 A. The voltage across the lamps is 30 V. Determine

a. the circuit impedance, in ohms.

b. the voltage loss across the reactor coil.

c. the inductive reactance of the inductor coil, in ohms.

d. the inductance of the reactor coil, in henrys.

e. the power factor and the angle of lag.

20. Using the circuit given in question 19

a. determine the power in watts used in the circuit.

b. determine the quadrature, or vertical power component, in VARs.

c. determine the apparent power, in volt-amperes.

d. draw an impedance triangle and a power triangle to scale.

e. draw a voltage vector diagram to scale.

image


Alternating-Current Circuits Containing Resistance : Current and voltage in phase , Heating effect of an alternating current , Effective (RMS) voltage and Resistance

Alternating-Current Circuits Containing Resistance
CURRENT AND VOLTAGE IN PHASE

A simple alternating-current circuit consists of resistance only. Either an incandescent lighting load or a heating load, such as a heater element, is a noninductive resistive load.

Operation of an AC Generator

In Figure 2–1, an ac generator supplies current to a 100-ohm (D) heater element. The output of this generator is a voltage sine wave with a maximum or peak value of 141.4 V. When the voltage in this circuit is zero, the current is zero. When the voltage is

image

at its maximum value, the current is also at maximum. When the voltage reverses direction, the current also reverses direction. When the current and the voltage waveforms of a circuit are zero at the same time and reach their maximum values at the same time and in the same direction, these waves are said to be in phase.

Figure 2–2 shows the voltage and current sine waves in phase for the circuit of Figure 2–1. Ohm’s law states that the current in a resistor is directly proportional to the voltage and inversely proportional to the magnitude of the resistance of the circuit. Note in Figure 2–2 that as the voltage increases from zero in either direction, the current increases proportionally in the same direction as required by Ohm’s law. Thus, Ohm’s law may be applied to ac circuits having a resistive load:

image

HEATING EFFECT OF AN ALTERNATING CURRENT

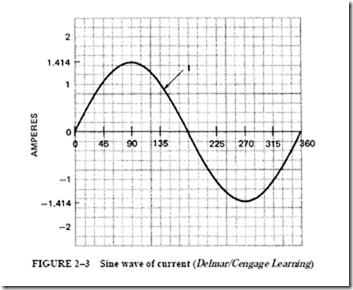
The alternating current in the circuit of Figure 2–1 is shown by the sine wave in Figure 2–3. The instantaneous maximum value of the current is 1.414 A.

If the current wave is considered for one complete cycle, then its average value is zero. This value is due to the fact that the negative alternation is equal to the positive alternation. If a dc ammeter is used to measure the current of this circuit, it will indicate zero. Thus, alternating current must be measured using an ac ammeter. Such an instrument measures the effective value of the current.

The effective value of alternating current is based on its heating effect and not on the average value of a sine-wave pattern. An alternating current with an effective value of one ampere is that current that will produce heat in a given resistance at the same rate as one ampere of direct current.

Plotting Sine Waves of Current

Direct Current Fundamentals showed that the heating effect of ac varies as the square of the current (watts I2R). For alternating current with a maximum value of 1.414 A, it is possible to plot a curve of the squared values of the current. If the horizontal scale of the curve is graduated in electrical time degrees, it is a relatively simple matter to obtain the instantaneous current values at regular intervals, such as 15° increments. The instantaneous values of current can then be squared and plotted to give a curve of current squared values for one cycle. For example, the instantaneous value of current at 30° is determined as follows:

image

image

direction of current is reversed in the negative alternation of the cycle. The current squared values are all positive. (Recall that when any two negative numbers are multiplied, the product is positive.)

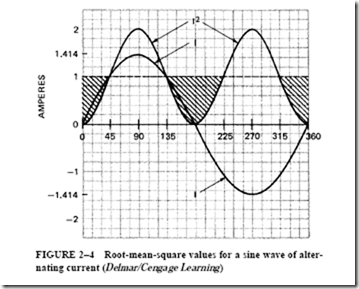
Graph of Sine Waves of Current. Figure 2–4 shows a sine wave of current that was plotted using the instantaneous current values given in Table 2–1. In addition, a current squared wave is also shown. This wave was plotted using the squared current values from Table 2–1.

The current squared wave in Figure 2–4 has a minimum value of 1.4142 or 2 A. Note that the entire current squared wave is positive because the square of a negative value is positive. The graph shows that the current squared wave has a frequency that is twice that of the sine wave of current. The average value of the current squared wave is 1.0 A and is indicated by the dashed line on the graph.

The two areas of the current squared wave above the dashed line are the same as the areas of the two shaded valleys below the dashed line. This average value of one ampere over a period of one cycle gives the same heating effect as one dc ampere. The rectangular area formed by the dashed line and the zero reference line represents the heating effect of this alternating current. It also shows the heating effect of one direct-current ampere over a period of one cycle.

Root-Mean-Square Value of AC Current

An alternating current with a maximum value of 1.414 A and a steady direct cur- rent of one ampere both produce the same average heating through a resistance in a period of one cycle. In other words, both currents have the same average squared value. This value is called the effective value or the root-mean-square (RMS) value of current. Root-mean-square current is the abbreviated form of “the square root of the mean of

image

the square of the instantaneous currents.” The RMS value of current is the current indicated by the typical ac ammeter. The relationship between the effective (RMS) current and the maximum current is

image

This means that the typical ac ammeter indicates 0.707 of the maximum value of a sine wave of current. This relationship can also be expressed as a ratio between the maxi- mum value and the RMS value, or M2, which is 1.414. For example, if an alternating current has an instantaneous maximum value of 20 A, an ac ammeter will read

image

Either of these two ratios can be used to find the maximum value of current when the RMS or effective value is known, For example, an ac ammeter indicates a value of 15 A. The maximum current is

image

In ac calculations, generally the effective value of current is used. This current is indicated by the letter I, which stands for intensity of current. The maximum current is shown as I .

EFFECTIVE (RMS) VOLTAGE

If one RMS ampere of alternating current passes through a resistance of one ohm, the RMS voltage drop across the resistor is one RMS ac volt. The RMS ac volt is 0.707 of the instantaneous maximum voltage. This RMS voltage is called the effective voltage. The typical ac voltmeter reads the effective value of voltage. The relationship between the maximum voltage and the effective voltage is the same as the one between the maximum current and the effective current.

The effective value of voltage is generally used in ac calculations. The effective voltage is indicated by the letter V. The maximum voltage is usually indicated by V .

For example, an ac voltmeter is connected across a lighting circuit and indicates a value of 120 V. What is the maximum instantaneous voltage across the circuit?

image

Unless otherwise specified, the voltage and current in an alternating-current circuit are always given as effective values. All standard ac ammeters and voltmeters indicate effective or RMS values.

Defining Terms

The following terms all relate to the sine wave: average, instantaneous, effective or RMS, peak, maximum, and peak-to-peak. These terms tend to confuse the student because they are closely related to each other. Figure 2–5 illustrates the various terms and their relationships.

RESISTANCE

In alternating-current circuits, the resistance is due to incandescent lighting loads and heating loads, just as in dc circuits. For these loads, inductance, hysteresis effects, and eddy current effects may be neglected. In a later unit of this text, the discussion will cover those factors that can change the ac impedance (resistance) of various types of loads. The term

image

impedance is generally used to describe the total current limiting effect in alternating current circuits. Impedance is a combination of all current limiting properties such as resistance, inductance, and capacitance. Impedance will be discussed in later chapters of this text.


Introduction to Alternating Current : Alternating-voltage generation , Frequency , Electrical time degrees and mechanical degrees , Other waveforms and Higher frequencies.


ALTERNATING-VOLTAGE GENERATION

A simple alternating-voltage generator consisting of a single coil rotating in a uniform magnetic field is shown in Figure 1–11.

The use of Fleming’s generator rule shows that an alternating voltage is generated in the coil as it rotates. If the ends of the coil are connected to two slip rings, the alternating voltage can be observed on an oscilloscope. This voltage pattern is a typical sine wave, as shown in Figure 1–12.

The generated voltage in an armature conductor is expressed by the formula

image_thumb[7]

is the generated voltage in the armature conductor in volts, B is the generated magnetic flux of the field, L is the length of the armature conductor in inches, v is the velocity of rotation of the coil in inches per second, and 108 represents 100,000,000 lines of force that must be cut per second to cause one volt to be induced.

One of the magnetic measurements in the English system is the weber. One weber rep- resents an amount of magnetic flux equal to 100,000,000 lines. Therefore, it can be stated that voltage is induced at a rate of one weber per second (1/Wb/s). The amount of voltage induced in a conductor is proportional to three factors:

1. The strength of the magnetic field (flux density)

2. The length of the conductor (often expressed as the number of turns of wire)

3. The speed of the cutting action

image_thumb[8]

Most ac generators have stationary coil windings and rotating field windings. How- ever, in Figure 1–11, the coil rotates and the field is stationary. In either case, the induced voltage in the coil windings depends upon the number of lines of force cut per second.

Development of an AC Sine Wave

To illustrate the development of the alternating-voltage sine-wave pattern shown in Figure 1–12, a more convenient form of the simple ac generator is needed.

A simple ac generator is shown in Figure 1–13. The conductors of the coil are moving parallel to the lines of force. At this instant, almost no lines of force are being cut and the generated voltage is zero.

In Figure 1–14 the conductors of the coil have moved counterclockwise to a point 30° from the starting position. The conductors of the coil are now cutting across the field flux. As a result, a voltage is induced in the coil. The instantaneous voltage in this position is determined by

vinstantaneous = Vmaximum X sin L

Assuming that the maximum voltage is 141.4 V, the induced voltage at 30° is vi = Vmax X sin 30° = 141.4 X 0.5000 = 70.7 V

Movement across a Magnetic Field. By examining the triangle in Figure 1–14, it can be seen that the total velocity of the conductor (V ) has two components. There is a useless vertical component (v ) parallel to the magnetic lines of force. The other component (v ) p c is a useful horizontal component that crosses, or is perpendicular to, the magnetic lines of

image_thumb[9]

force. Because voltage is generated only by the movement that cuts the magnetic field, the right triangle is solved for the v component:

vc = VT X sin 30°

Note the similarity between the equations expressing velocity, voltage, and projections on the Y axis:

image_thumb[10]

• Equation 1 was derived from a coil revolving in a magnetic field where the velocity components are resolved perpendicular to the magnetic field.

• Equation 2 was derived from a coil revolving in a magnetic field where the maximum voltage components are resolved into instantaneous voltage.

• Equation 3 was derived from rotating a line counterclockwise and taking the magnitude of its projection on the Y axis. In other words, R is resolved into its Y shadow.

The values vc , v, and y in equations 1 through 3 are called instantaneous values of the sine wave. VT , Vmax , and R are called the maximum values of the sine wave. The general forms of a voltage sine wave and a current sine wave are

image_thumb[11]

The coil at 45°. In Figure 1–15 the coil is at a new position 45° from the starting position. Refer to the right triangle construction in the figure. The component of the angular velocity has increased slightly (as compared to Figure 1–14). There is a proportional increase in the induced voltage to an instantaneous value determined as follows:

image_thumb[12]

The coil at 90°. In Figure 1–16 the coil has rotated to an angle of 90° from the starting position. The sine of 90° is 1.0; therefore, the generated voltage has a maximum value of 141.4 V. The conductors of the coil are perpendicular to the flux field. Because the greatest number of lines of flux are cut in a given time period in this position, the induced voltage must be a maximum value. As the armature coil continues to rotate counterclockwise, the direction and the instantaneous value of voltage can be deter- mined for any angle through 360° (one complete revolution). The resulting waveform is a sine wave of voltage. For each angular position of the coil in the magnetic field, the direction of the generated voltage can be obtained by Fleming’s generator rule. The value of the instantaneous voltage generated in the coil for each angular position can be found from the sine of the angle times Vmax .

During the design and construction of ac generators, an attempt is made to ensure a nearly perfect sine-wave voltage output. Motors, transformers, and other electrical equipment have better operating characteristics when they receive electrical energy from such ac generators.

image_thumb[13]

image_thumb[14]

Defining Alternating Voltage and Current

Alternating voltage may be defined as an electromotive force that changes continuously with time. It rises from zero to a maximum value in one direction and decreases back to zero. It then rises to the same maximum value in the opposite direction and again decreases to zero. These values are repeated again and again at equal intervals of time.

The alternator shown in Figure 1–11 is connected to a resistor, which is the external load. The alternating voltage of this generator causes an alternating current to be supplied to the load. As the alternating voltage varies in magnitude and direction, the current (in amperes) varies proportionally. Alternating current may be defined in a manner that is similar to the definition of alternating voltage. Refer to Figure 1–17.

Alternating current is a current that changes continuously with time. It rises from zero to a maximum value in one direction and decreases back to zero. It then rises to the same maximum value in the opposite direction and again decreases to zero. These values are repeated again and again at equal intervals of time.

FREQUENCY

The number of complete events or cycles per second is the frequency, measured in hertz. Sixty cycles per second equals 60 hertz, or 60 Hz.

In the United States and Canada, 60 Hz is used almost exclusively, with the exception of a few areas that use 25-Hz service. The advantage to using a higher-frequency service is that less iron and copper are required in the transformers. Therefore, they are lighter and lower in cost. Also, incandescent lamps operating at 60 Hz have no noticeable flicker. At 25 Hz, the flicker of incandescent lamps can be annoying.

The speed of a generator and the number of poles determine the frequency of the generated voltage. If a generator has two poles (north and south), and the coils rotate at a speed

of one revolution per second, the frequency is one cycle per second. If the generator has two pairs of poles, then a cycle is generated every half-revolution, or 2 hertz per second (2 Hz/s).

Frequency of an AC Generator

In the simple alternator, one cycle of voltage is produced each time the coil makes one revolution between the two poles. If this coil makes 60 revolutions per second, the alternating voltage generated will have a frequency of 60 cycles per second (60 Hz). The frequency of an ac generator is expressed by the following formula

image_thumb[15]

Because there may be some confusion in using pairs of poles in the frequency formula, it is common practice to use the total number of poles of the alternator. In this case, the time constant of 60 s is doubled. For example, if a four-pole alternator turns at 1800 r/min, the frequency of the voltage output of the machine is

image_thumb[16]

ELECTRICAL TIME DEGREES AND MECHANICAL DEGREES

When a coil makes one revolution in a generator with two poles, one cycle of voltage is generated. However, when a coil makes one revolution in a generator with four poles (Figure 1–18), two cycles of voltage are generated. Thus, a distinction must be made between mechanical and electrical degrees.

image_thumb[17]

When a coil or armature conductor makes one complete revolution, it passes through 360 mechanical degrees.

When an electromotive force or an alternating current passes through one cycle, it passes through 360 electrical time degrees.

As the number of poles in an ac generator increases, the actual required driven speed in r/min decreases proportionally for a given frequency. The relationship between speed, number of poles, and frequency is shown in Table 1–1. The frequency values may be checked using the following frequency equation:

f = P X S + 120

The values for the number of poles and the speed in r/min may be substituted in the formula for each frequency value.

image_thumb[18]

OTHER WAVEFORMS

Alternating-voltage waveforms are not all sine waves. For example, a square-wave output or a rectangular output can be generated by electronic equipment, such as a signal generator. One type of electronic oscillator has a voltage output pattern that resembles a sawtooth (Figure 1–19).

For electrical energy transmitted at frequencies of 60 Hz and 25 Hz, the voltage wave pattern may be distorted so that it is not a true sine wave. Such distortion is due to conditions that may exist in ac generators, transformers, and other equipment. A distorted wave pattern consists of a fundamental wave (which is the frequency of the circuit) and other waves having higher frequencies. These waves are called harmonics and are superimposed on the fundamental wave. The exact appearance of the distorted wave will depend on the frequencies, magnitudes, and phase relationships of the voltage waves superimposed on the fundamental wave. For example, assume that a harmonic wave having a frequency three times that of the fundamental wave is superimposed on the fundamental wave (Figure 1–20). The resulting distorted wave pattern depends on the phase relationship between the harmonic wave and the fundamental wave.

image_thumb[19]

In Figure 1–20 the harmonic wave is shown referred to the zero axis. It has a frequency three times that of the fundamental and is superimposed on the fundamen- tal wave. Note that the resultant pattern of the fundamental wave is different in the two diagrams. The difference arises because the phase relationship of the harmonic wave with the fundamental wave in the two illustrations is different.

This text cannot cover the various circuit problems involving unique ac voltage wave patterns. Therefore, it will be assumed that sine-wave voltage and current values are used throughout this text, unless otherwise noted.

HIGHER FREQUENCIES

It was noted earlier that the most common frequency used for the transmission of electrical energy is 60 Hz. Another value commonly used in aircraft and in other mobile equipment is 400 Hz.

In electronics, the frequencies used cover a very wide range. For example, audio frequencies between 20 and 16,000 Hz are used to operate speakers in amplifier units and radio receivers. Transmitted frequencies above 15,000 Hz are called radio frequencies. These higher frequencies are expressed in units of kilohertz (1 kHz = 1000 Hz), megahertz (1 MHz = 1,000,000 Hz or 1000 kHz), and gigahertz (1 GHz = 1,000,000,000 Hz or 1000 MHz).

SUMMARY

• Alternating current is more commonly used, but there are a number of applications where direct-current systems must be used or will do the job more efficiently than ac.

• AC alternators operate economically at relatively high voltages and heavy current ratings. DC generators are limited in both high voltages and large current ratings.

• The generation of large amounts of ac energy in large central stations is a more efficient and economical operation than in smaller local units.

• AC electrical energy can be transmitted at very high voltages over long distances (lowering I2R losses). Transformers raise or lower voltages as needed at generating stations or distribution points. Transformers cannot be used on dc systems.

• The ac induction motor is simple and rugged in construction. It has excellent operating characteristics and is far more economical in initial costs, replacement, and maintenance than are dc motors.

• The sine wave is the function of the position of a coil in a magnetic field.

• The cosine wave has the same pattern as the sine wave, but reaches its maximum value 90° before the sine wave.

• Quadrants in a coordinate system are numbered counterclockwise.

• Angles are measured from the positive X axis to the indicated line in the counterclock- wise direction.

• Angles measured in the clockwise direction from the positive X axis to the indicated line are negative because the direction of measurement has changed.

• The formula for the induced voltage in an armature conductor is

image_thumb[20]

•The induced voltage is directly proportional to the velocity component, V = vc /(sin L8), which is perpendicular to the magnetic field.

• The instantaneous value of alternating voltage is given by

image_thumb[21]

Alternating voltage is a voltage that changes continuously with time. It rises from zero to a maximum value in one direction, decreases to zero, rises to the same maximum value in the opposite direction, again decreases to zero, and then repeats these values at equal intervals of time.

Alternating current is a current that changes continuously with time. It rises from zero to a maximum value in one direction, decreases to zero, rises to the same maximum value in the opposite direction, again decreases to zero, and then repeats these values at equal intervals of time.

• A cycle of alternating voltage or alternating current can be defined as that voltage or current that rises from zero to a positive maximum value, returns to zero, then rises to a negative maximum value, again returns to zero, and repeats these values at equal intervals of time.

Frequency is the number of complete events or cycles per second (Hz) of alternating voltage or alternating current.

• Each cycle is divided into two alternations, with each alternation equal to 180 electrical time degrees.

• The relationship between the number of poles, speed, and frequency is expressed by

image_thumb[22]

• As the number of poles in an ac generator increases, the actual required driven speed in r/min decreases proportionally for a given frequency.

• When using a higher frequency, less iron and copper are required in transformers, motors, and other electrical equipment.

• Alternating-voltage waveforms are not all sine waves. They may be distorted wave- forms caused by harmonics superimposed on the fundamental wave.

clip_image002[1]_thumbclip_image002[2]_thumbAchievement Review

1. State four reasons why most electrical energy produced is generated by alternators rather than by direct-current generators.

2. List five applications in which direct current is preferred over alternating current.

3. Name several ways by which alternating current is changed or rectified into direct current.

4. Explain the difference between the rotating line method and the rotating coil method of generating a sine wave.

5. Assuming that the rotating line of Figure 1–8 has a length of one unit, determine its projection or shadow on the X and Y axes at 30°, 45°, 120°, and 240°. (Refer to Figure 1–5 and Appendices 4 and 5.)

6. Prove that tan 8 = (sin 8)/(cos 8). (Refer to Figure 1–5.)

7. Using the answers to question 5, determine the tangents for 30°, 45°, 120°, and 240°. (Refer to Figure 1–5.) Check the answers with Appendices 4 and 5.

8. A sine-wave voltage produced by an ac generator has a maximum value of 170 V. Determine the instantaneous voltage at 45 electrical degrees after crossing the zero axis in a positive direction.

9. Determine the instantaneous voltage of the generator in question 8 at 240 electrical degrees.

10. The speed of a six-pole alternator is 1200 r/min. Determine the frequency of the output of the generator.

11. A 25-Hz alternator has two poles. Determine the speed of the alternator in r/min.

12. Two ac generators are to be operated in parallel at the same frequency. Alternator 1 has four poles and turns at a speed of 1800 r/min. Alternator 2 has 10 poles.

a. What is the frequency of alternator 1?

b. What speed must alternator 2 have so that it can operate in parallel with alternator 1?

13. Explain the difference between electrical time degrees and mechanical degrees.

14. Define (a) cycle, (b) alternation, (c) frequency.

15. Why is 60-Hz alternating-current service preferred to a frequency of 25 Hz in most areas of the United States and Canada?

16. Plot a sine wave of voltage for 360° or one cycle. The voltage has an instantaneous maximum value of 300 V.

17. Explain what is meant by a fundamental sine wave with a triple-frequency harmonic.

18. What is the advantage in using a frequency higher than 60 Hz for the electrical systems of various types of aircraft?

19.

image_thumb[23]