An Introduction to Electric Circuits

Electrical/Electronic System Block Diagrams

An electrical/electronic system is a group of components connected together to perform a desired function. Figure 40.1 shows a simple public address system, where a microphone is used to collect acoustic energy in the form of sound pressure waves and converts this to electrical energy in the form of small voltages and currents; the signal from the microphone is then amplified by means of an electronic circuit containing transistors/integrated circuits before it is applied to the loudspeaker.

A sub-system is a part of a system that performs an identified function within the whole system; the amplifier in Figure 40.1 is an example of a sub-system.

A component or element is usually the simplest part of a system that has a specific and well-defined function — for example, the microphone in Figure 40.1.

The illustration in Figure 40.1 is called a block diagram and electrical/ electronic systems, which can often be quite complicated, can be better under-stood when broken down in this way. It is not always necessary to know precisely what is inside each sub-system in order to know how the whole system functions.

As another example of an engineering system, Figure 40.2 illustrates a temperature control system containing a heat source (such as a gas boiler), a fuel controller (such as an electrical solenoid valve), a thermostat and a source of electrical energy. The system of Figure 40.2 can be shown in block diagram form as in Figure 40.3; the thermostat compares the actual room temperature with the desired temperature and switches the heating on or off.

There are many types of engineering systems. A communications system is an example, where a local area network could comprise a file server, coaxial cable, network adapters, several computers and a laser printer;an electromechanical system is another example, where a car electrical sys- tem could comprise a battery, a starter motor, an ignition coil, a contact breaker and a distributor. Block diagrams may represent all such systems as these.

image

image

Standard Symbols for Electrical Components

Symbols are used for components in electrical circuit diagrams and some of the more common ones are shown in Figure 40.4.

Electric Current and Quantity of Electricity

All atoms consist of protons, neutrons and electrons. The protons, which have positive electrical charges, and the neutrons, which have no electrical charge, are contained within the nucleus. Removed from the nucleus are minute negatively charged particles called electrons. Atoms of different materials differ from one another by having different numbers of protons, neutrons and electrons. An equal number of protons and electrons exist within an atom

clip_image007

Figure 40.4

and it is said to be electrically balanced, as the positive and negative charges cancel each other out. When there are more than two electrons in an atom the electrons are arranged into shells at various distances from the nucleus.

All atoms are bound together by powerful forces of attraction existing between the nucleus and its electrons. Electrons in the outer shell of an atom, however, are attracted to their nucleus less powerfully than are electrons whose shells are nearer the nucleus.

It is possible for an atom to lose an electron; the atom, which is now called an ion, is not now electrically balanced, but is positively charged and is thus able to attract an electron to itself from another atom. Electrons that move from one atom to another are called free electrons and such random motion can continue indefinitely. However, if an electric pressure or voltage is applied across any material there is a tendency for electrons to move in a particular direction. This movement of free electrons, known as drift, constitutes an electric current flow. Thus current is the rate of movement of charge.

Conductors are materials that contain electrons that are loosely connected to the nucleus and can easily move through the material from one atom to another. Insulators are materials whose electrons are held firmly to their nucleus.

image

Electrical Potential and e.m.f.

The unit of electric potential is the volt (V), where one volt is one joule per coulomb. One volt is defined as the difference in potential between two points in a conductor which, when carrying a current of one ampere, dissipates a power of one watt, i.e.

image

A change in electric potential between two points in an electric circuit is called a potential difference (p.d.). The electromotive force (e.m.f.) provided by a source of energy such as a battery or a generator is measured in volts.

For a continuous current to flow between two points in a circuit a potential difference or voltage, V, is required between them; a complete conducting path is necessary to and from the source of electrical energy.

Figure 40.5 shows a cell connected across a filament lamp. Current flow, by convention, is considered as flowing from the positive terminal of the cell, around the circuit to the negative terminal.

image

Resistance and Conductance

The flow of electric current is subject to friction. This friction, or opposition, is called resistance R and is the property of a conductor that limits current. The unit of electric resistance is the ohm (Z); 1 ohm is defined as the resistance that will have a current of 1 ampere flowing through it when 1 volt is connected across it.

image

where V is the potential difference across the two points, in volts, and I is the current flowing between the two points, in amperes.

The reciprocal of resistance is called conductance and is measured in siemens (S). Thus,

image

Basic Electrical Measuring Instruments

An ammeter is an instrument used to measure current and must be connected in series with the circuit. Figure 40.5 shows an ammeter connected in series with the lamp to measure the current flowing through it. Since all the current in the circuit passes through the ammeter it must have a very low resistance.

A voltmeter is an instrument used to measure p.d. and must be connected in parallel with the part of the circuit whose p.d. is required. In Figure 40.5, a voltmeter is connected in parallel with the lamp to measure the p.d. across it. To avoid a significant current flowing through it a voltmeter must have a very high resistance.

An ohmmeter is an instrument for measuring resistance.

A multimeter, or universal instrument, may be used to measure voltage, current and resistance. An ‘Avometer’ is a typical example.

The cathode ray oscilloscope (CRO) may be used to observe waveforms and to measure voltages and currents. The display of a CRO involves a spot of light moving across a screen. The amount by which the spot is deflected from its initial position depends on the p.d. applied to the terminals of the CRO and the range selected. The displacement is calibrated in ‘volts per cm’. For example, if the spot is deflected 3 cm and the volts/cm switch is on 10 V/cm then the magnitude of the p.d. is 3 cm x10 V/cm, i.e. 30 V.

(See Chapter 50 for more detail about electrical measuring instruments and measurements)

Linear and Non-linear Devices

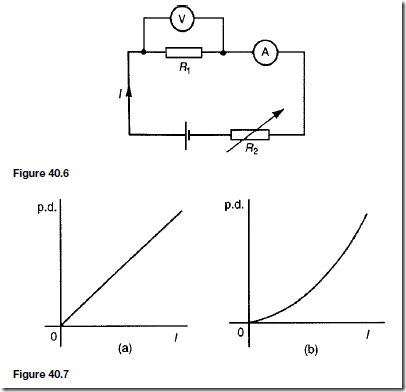
Figure 40.6 shows a circuit in which current I can be varied by the variable resistor R2. For various settings of R2, the current flowing in resistor R1 ,

image

displayed on the ammeter, and the p.d. across R1 , displayed on the voltmeter, are noted and a graph is plotted of p.d. against current. The result is shown in Figure 40.7(a) where the straight-line graph passing through the origin indicates that current is directly proportional to the p.d. Since the gradient, i.e.

p.d./current is constant, resistance R1 is constant. A resistor is thus an example of a linear device.

If the resistor R1 in Figure 40.6 is replaced by a component such as a lamp then the graph shown in Figure 40.7(b) results when values of p.d. are noted for various current readings. Since the gradient is changing, the lamp is an example of a non-linear device.

Ohm’s Law

Ohm’s law states that the current I flowing in a circuit is directly proportional to the applied voltage V and inversely proportional to the resistance R, provided the temperature remains constant. Thus,

image

image

Multiples and Sub-multiples

Currents, voltages and resistances can often be very large or very small. Thus multiples and sub-multiples of units are often used, as stated in chapter 1. The most common ones, with an example of each, are listed in Table 40.1.

For example, a 100 V battery is connected across a resistor and causes a current of 5 mA to flow. The resistance of the resistor is given by:

image

Conductors and Insulators

A conductor is a material having a low resistance that allows electric current to flow in it. All metals are conductors and some examples include copper, aluminium, brass, platinum, silver, gold and carbon.

An insulator is a material having a high resistance that does not allow electric current to flow in it. Some examples of insulators include plastic, rubber, glass, porcelain, air, paper, cork, mica, ceramics and certain oils.

Electrical Power

The product of potential difference V and current I gives power P in an electrical circuit. The unit of power is the watt, W.

image

Electrical Energy

Electrical energy = power × time

If the power is measured in watts and the time in seconds then the unit of energy is watt-seconds or joules. If the power is measured in kilowatts and the time in hours then the unit of energy is kilowatt-hours, often called the ‘unit of electricity’. The ‘electricity meter’ in the home records the number of kilowatt-hours used and is thus an energy meter.

image

For example, electrical equipment in an office takes a current of 13 A from a 240 V supply. If the equipment is used for 30 hours each week and 1 kWh of energy costs 7p, the cost per week of electricity is calculated as follows:

image

image

Main Effects of Electric Current

The three main effects of an electric current are: (a) magnetic effect

(b) chemical effect (c) heating effect

Some practical applications of the effects of an electric current include:

Magnetic effect: bells, relays, motors, generators, transformers, telephones, car-ignition and lifting magnets (see chapter 47)

Chemical effect: primary and secondary cells and electroplating (see chapter 42)

Heating effect: cookers, water heaters, electric fires, irons, furnaces, kettles and soldering irons

Fuses

A fuse is used to prevent overloading of electrical circuits. The fuse, which is made of material having a low melting point, utilises the heating effect of an electric current. A fuse is placed in an electrical circuit and if the current becomes too large the fuse wire melts and so breaks the circuit. A circuit diagram symbol for a fuse is shown in Figure 40.1, on page 207.

For example, an electric toaster has a power rating of 1 kW, and is connected to a 240 V supply.Power taken, P = VI, from which,

image

Hence a 5 A fuse is most appropriate for the toaster.


Simple Harmonic Motion and Natural Vibrations

Simple Harmonic Motion

Simple harmonic motion is defined as a periodic motion of a point along a straight line, such that its acceleration is always towards a fixed point in that line and is proportional to its distance from that point.

Simple harmonic motion (SHM) may be considered as the projection on a diameter of a movement at uniform speed around the circumference of a circle.

In Figure 39.1, P moves with uniform speed v(D ωr) around a circle of radius r; the point X projected from P on diameter AB moves with SHM.

The acceleration of P is the centripetal acceleration, ω2r. The displacement (measured from the mean position O), the velocity and acceleration of X are respectively:

image

The expressions for velocity and acceleration can be derived from that for displacement by differentiating with respect to time. The negative signs in the expressions for velocity and acceleration show that for the position X in Figure 36.1, both velocity and acceleration are in the opposite direction from the displacement. Displacement and acceleration are always in opposite directions. The periodic time T of the motion is the time taken for one complete

image

image

Natural Vibration

Motion closely approximating to SHM occurs in a number of natural or free vibrations. Many examples are met where a body oscillates under a control that

image

obeys Hooke’s law, for example, a spring or a beam. Consider, for example, the helical spring shown in Figure 39.2. If, from its position of rest, the mass M is pulled down a distance r and then released, the mass will oscillate in a vertical line. In the rest position, the force in the spring will exactly balance the force of gravity on the mass.

If s is the stiffness of the spring, that is, force per unit change of length, then for a displacement x from the rest position, the change in the force in the spring is sx. This change of force is the unbalanced or accelerating force F acting on the mass M, i.e. F = sx

image

This shows that the acceleration is directly proportional to displacement from its rest position. The motion is therefore SHM. The periodic time is given by:

For example, a load of 10 kg is hung from a vertical helical spring and it causes an extension of 15 mm. The load is pulled down a further distance of 18 mm and then released.

Thus, the weight of the load = Mg = 10 x 9.81 = 98.1 N Stiffness of spring,

image

Frequency of the vibration,

image

Simple Pendulum

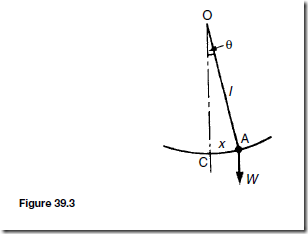
Another common example of a vibration giving a close approximation to SHM is the movement of a simple pendulum. This is defined as a mass of negligible dimensions on the end of a cord or rod of negligible mass. For a small displacement x of the bob A from its mean position C in Figure 39.3, the accelerating force F on the bob, weight W, is W sin (), which very nearly equals W() if () is a small angle and measured in radians.

image

image

The angular motion of the pendulum must not be confused with the angular motion of an imaginary line used in the analysis of simple harmonic motion. The imaginary line (OP in Figure 39.1) rotates at a constant speed. The angular velocity of the pendulum is variable, having its maximum value in the vertical position. For a velocity v of the bob, the angular velocity of the pendulum is:

image

The angular acceleration of the pendulum is greatest in the extreme positions. For an acceleration a of the bob, the angular acceleration of the pendulum is:

image


Measurement of Fluid Flow

Introduction

The measurement of fluid flow is of great importance in many industrial processes, some examples including air flow in the ventilating ducts of a coal mine, the flow rate of water in a condenser at a power station, the flow rate of liquids in chemical processes, the control and monitoring of the fuel, lubricating and cooling fluids of ships and aircraft engines, and so on. Fluid flow is one of the most difficult of industrial measurements to carry out, since flow behaviour depends on a great many variables concerning the physical properties of a fluid.

There are available a large number of fluid flow measuring instruments

generally called flowmeters, which can measure the flow rate of liquids (in m3/s) or the mass flow rate of gaseous fluids (in kg/s). The two main categories of flowmeters are differential pressure flowmeters and mechanical flowmeters.

Differential Pressure Flowmeters

When certain flowmeters are installed in pipelines they often cause an obstruction to the fluid flowing in the pipe by reducing the cross-sectional area of the pipeline. This causes a change in the velocity of the fluid, with a related change in pressure. Figure 38.1 shows a section through a pipeline into which a flowmeter has been inserted. The flow rate of the fluid may be determined from a measurement of the difference between the pressures on the walls of the pipe at specified distances upstream and downstream of the flowmeter. Such devices are known as differential pressure flowmeters.

The pressure difference in Figure 38.1 is measured using a manometer connected to appropriate pressure tapping points. The pressure is seen to be greater upstream of the flowmeter than downstream, the pressure difference being shown as h.

image

Calibration of the manometer depends on the shape of the obstruction, the positions of the pressure tapping points and the physical properties of the fluid.

In industrial applications the pressure difference is detected by a differential pressure cell, the output from which is either an amplified pressure signal or an electrical signal.

Examples of differential pressure flowmeters commonly used include:

(a) Orifice plate

(b) Venturi tube

(c) Flow nozzles

(d) Pitot-static tube

British Standard reference BS 1042: Part 1: 1964 and Part 2A: 1973 ‘Methods for the measurement of fluid flow in pipes’ gives specifications for measurement, manufacture, tolerances, accuracy, sizes, choice, and so on, of differential flowmeters.

Orifice Plate

Construction

An orifice plate consists of a circular, thin, flat plate with a hole (or orifice) machined through its centre to fine limits of accuracy. The orifice has a diameter less than the pipeline into which the plate is installed and a typical section of an installation is shown in Figure 38.2(a). Orifice plates are manufactured in stainless steel, monel metal, polyester glass fibre, and for large pipes, such as sewers or hot gas mains, in brick and concrete.

Principles of operation

When a fluid moves through a restriction in a pipe, the fluid accelerates and a reduction in pressure occurs, the magnitude of which is related to the flow rate of the fluid. The variation of pressure near an orifice plate is shown in Figure 38.2(b). The position of minimum pressure is located downstream from the orifice plate where the flow stream is narrowest. This point of minimum cross-sectional area of the jet is called the ‘vena contracta’. Beyond this point the pressure rises but does not return to the original upstream value and there is a permanent pressure loss. This loss depends on the size and type of orifice plate, the positions of the upstream and downstream pressure tappings and the change in fluid velocity between the pressure tappings that depends on the flow rate and the dimensions of the orifice plate.

In Figure 38.2(a) corner pressure tappings are shown at A and B. Alternatively, with an orifice plate inserted into a pipeline of diameter d, pressure tappings are often located at distances of d and d/2 from the plate respectively upstream and downstream. At distance d upstream the flow pattern is not influenced by the presence of the orifice plate and distance d/2 coincides with the vena contracta

image

Advantages of orifice plates

(i) They are relatively inexpensive

(ii) They are usually thin enough to fit between an existing pair of pipe flanges

Disadvantages of orifice plates

(i) The sharpness of the edge of the orifice can become worn with use, causing calibration errors

(ii) The possible build-up of matter against the plate

(iii) A considerable loss in the pumping efficiency due to the pressure loss downstream of the plate

Applications

Orifice plates are usually used in medium and large pipes and are best suited to the indication and control of essentially constant flow rates. Several applications are found in the general process industries.

Venturi Tube

Construction

The Venturi tube or venturimeter is an instrument for measuring with accuracy the flow rate of fluids in pipes. A typical arrangement of a section through such a device is shown in Figure 38.3, and consists of a short converging conical tube called the inlet or upstream cone, leading to a cylindrical portion called

image

the throat. A diverging section called the outlet or recovery cone follows this. The entrance and exit diameter is the same as that of the pipeline into which it is installed. Angle ˇ is usually a maximum of 21°, giving a taper of ˇ/2 of 10.5° . The length of the throat is made equal to the diameter of the throat. Angle ˛ is about 5° to 7° to ensure a minimum loss of energy but where this is unimportant ˛ can be as large as 14° to 15°.

Pressure tappings are made at the entry (at A) and at the throat (at B) and the pressure difference h which is measured using a manometer, a differential pressure cell or similar gauge, is dependent on the flow rate through the meter. Usually pressure chambers are fitted around the entrance pipe and the throat circumference with a series of tapping holes made in the chamber to which the manometer is connected. This ensures that an average pressure is recorded. The loss of energy due to turbulence that occurs just downstream with an orifice plate is largely avoided in the venturimeter due to the gradual divergence beyond the throat. Venturimeters are usually made a permanent installation in a pipeline and are manufactured usually from stainless steel, cast iron, monel metal or polyester glass fibre.

Advantages of venturimeters

(i) High accuracy results are possible

(ii) There is a low-pressure loss in the tube (typically only 2% to 3% in a well proportioned tube)

(iii) Venturimeters are unlikely to trap any matter from the fluid being metered

Disadvantages of venturimeters

(i) High manufacturing costs

(ii) The installation tends to be rather long (typically 120 mm for a pipe of internal diameter 50 mm)

Flow Nozzle

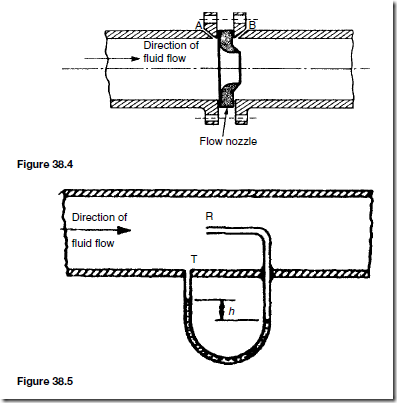
The flow nozzle lies between an orifice plate and the venturimeter both in performance and cost. A typical section through a flow nozzle is shown in Figure 38.4 where pressure tappings are located immediately adjacent to the upstream and downstream faces of the nozzle (i.e. at points A and B). The fluid flow does not contract any further as it leaves the nozzle and the pressure loss created is considerably less than that occurring with orifice plates. Flow nozzles are suitable for use with high velocity flows for they do not suffer the wear that occurs in orifice plate edges during such flows.

Pitot-static Tube

A Pitot-static tube is a device for measuring the velocity of moving fluids or of the velocity of bodies moving through fluids. It consists of one tube, called the Pitot tube, with an open end facing the direction of the fluid motion, shown as pipe R in Figure 38.5, and a second tube, called the piezometer tube, with the opening at 90° to the fluid flow, shown as T in Figure 38.5. Pressure recorded by a pressure gauge moving with the flow, i.e. static or stationary relative to the fluid, is called free stream pressure and connecting a pressure

image

image

gauge to a small hole in the wall of a pipe, such as point T in Figure 38.5, is the easiest method of recording this pressure. The difference in pressure (pR = pT ), shown as h in the manometer of Figure 35.5, is an indication of the speed of the fluid in the pipe.

Figure 38.6 shows a practical Pitot-static tube consisting of a pair of con- centric tubes. The centre tube is the impact probe that has an open end which faces ‘head-on’ into the flow. The outer tube has a series of holes around its circumference located at right angles to the flow, as shown by A and B in Figure 38.6. The manometer, showing a pressure difference of h, may be calibrated to indicate the velocity of flow directly.

Applications

A Pitot-static tube may be used for both turbulent and non-turbulent flow. The tubes can be made very small compared with the size of the pipeline and the monitoring of flow velocity at particular points in the cross-section of a duct can be achieved. The device is generally unsuitable for routine measurements and in industry is often used for making preliminary tests of flow rate in order to specify permanent flow measuring equipment for a pipeline. The main use of Pitot tubes is to measure the velocity of solid bodies moving through fluids, such as the velocity of ships. In these cases, the tube is connected to a Bourdon pressure gauge that can be calibrated to read velocity directly. A development of the Pitot tube, a pitometer, tests the flow of water in water mains and detects leakages.

Advantages of Pitot-static tubes

(i) They are inexpensive devices

(ii) They are easy to install

(iii) They produce only a small pressure loss in the tube

(iv) They do not interrupt the flow

Disadvantages of Pitot-static tubes

(i) Due to the small pressure difference, they are only suitable for high velocity fluids

(ii) They can measure the flow rate only at a particular position in the cross- section of the pipe

(iii) They easily become blocked when used with fluids carrying particles

Mechanical Flowmeters

With mechanical flowmeters, the fluid flowing past it displaces a sensing element situated in a pipeline.

Examples of mechanical flowmeters commonly used include:

(a) Deflecting vane flowmeter

(b) Turbine type meters

Deflecting Vane Flowmeter

The deflecting vane flowmeter consists basically of a pivoted vane suspended in the fluid flow stream as shown in Figure 38.7

When a jet of fluid impinges on the vane it deflects from its normal position by an amount proportional to the flow rate. The movement of the vane is indicated on a scale that may be calibrated in flow units. This type of meter is normally used for measuring liquid flow rates in open channels or for measuring the velocity of air in ventilation ducts. The main disadvantages of this device are that it restricts the flow rate and it needs to be recalibrated for fluids of differing densities.

Turbine Type Meters

Turbine type flowmeters are those that use some form of multi-vane rotor and are driven by the fluid being investigated. Three such devices are the

image

cup anemometer, the rotary vane positive displacement meter and the turbine flowmeter.

(a) Cup anemometer. An anemometer is an instrument that measures the velocity of moving gases and is most often used for the measurement of wind speed. The cup anemometer has three or four cups of hemispherical shape mounted at the end of arms radiating horizontally from a fixed point. The cup system spins round the vertical axis with a speed approximately proportional to the velocity of the wind. With the aid of a mechanical and/or electrical counter the wind speed can be determined and the device is easily adapted for automatic recording.

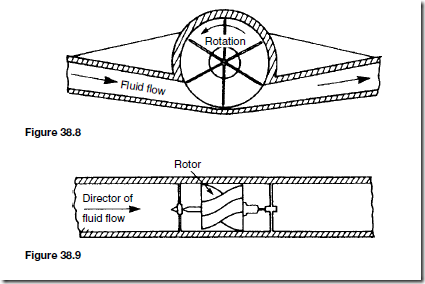
(b) Rotary vane positive displacement meters measure the flow rate by indicating the quantity of liquid flowing through the meter in a given time. A typical device is shown in section in Figure 38.8 and consists of a cylindrical chamber into which is placed a rotor containing a number of vanes (six in this case). Liquid entering the chamber turns the rotor and a known amount of liquid is trapped and carried round to the outlet. If x is the volume displaced by one blade then for each revolution of the rotor in Figure 35.8 the total volume displaced is 6x. The rotor shaft may be coupled to a mechanical counter and electrical devices which may be calibrated to give flow volume. This type of meter in its various forms is used widely for the measurement of domestic and industrial water consumption, for the accurate measurement of petrol in petrol pumps and for the consumption and batch control measurements in the general process and food industries for measuring flows as varied as solvents, tar and molasses (i.e. thickish treacle).

(c) A turbine flowmeter contains in its construction a rotor to which blades are attached which spin at a velocity proportional to the velocity of the fluid which flows through the meter. A typical section through such a meter is shown in Figure 38.9. The number of revolutions made by the turbine blades may be determined by a mechanical or electrical device enabling the flow rate or total flow to be determined. Advantages

image

of turbine flowmeters include a compact durable form, high accuracy, wide temperature and pressure capability and good response characteristics. Applications include the volumetric measurement of both crude and refined petroleum products in pipelines up to 600 mm bore, and in the water, power, aerospace, process and food industries, and with modification may be used for natural, industrial and liquid gas measurements. Turbine flowmeters require periodic inspection and cleaning of the working parts.

Float and Tapered-tube Meter

Principle of operation

With orifice plates and venturimeters the area of the opening in the obstruction is fixed and any change in the flow rate produces a corresponding change in pressure. With the float and tapered-tube meter the area of the restriction may be varied so as to maintain a steady pressure differential. A typical meter of this type is shown diagrammatically in Figure 38.10 where a vertical tapered tube contains a ‘float’ that has a density greater than the fluid.

The float in the tapered tube produces a restriction to the fluid flow. The fluid can only pass in the annular area between the float and the walls of the tube. This reduction in area produces an increase in velocity and hence a pressure difference, which causes the float to rise. The greater the flow rate,

image

the greater is the rise in the float position, and vice versa. The position of the float is a measure of the flow rate of the fluid and this is shown on a vertical scale engraved on a transparent tube of plastic or glass. For air, a small sphere is used for the float but for liquids there is a tendency to instability and the float is then designed with vanes that cause it to spin and thus stabilize itself as the liquid flows past. Such meters are often called ‘rotameters’. Calibration of float and tapered tube flowmeters can be achieved using a Pitot-static tube or, more often, by using a weighing meter in an instrument repair workshop.

Advantages of float and tapered-tube flowmeters

(i) They have a very simple design

(ii) They can be made direct reading

(iii) They can measure very low flow rates

Disadvantages of float and tapered-tube flowmeters

(i) They are prone to errors, such as those caused by temperature fluctuations

(ii) They can only be installed vertically in a pipeline

(iii) They cannot be used with liquids containing large amounts of solids in suspension

(iv) They need to be recalibrated for fluids of different densities

Practical applications of float and tapered-tube meters are found in the medical field, in instrument purging, in mechanical engineering test rigs and in simple process applications, in particular for very low flow rates. Many corrosive fluids can be handled with this device without complications.

Electromagnetic Flowmeter

The flow rate of fluids that conduct electricity, such as water or molten metal, can be measured using an electromagnetic flowmeter whose principle of operation is based on the laws of electromagnetic induction. When a conductor of length l moves at right angles to a magnetic field of density B at a velocity v, an induced e.m.f. e is generated, given by e D Blv (see Chapter 48, page 271).

With the electromagnetic flowmeter arrangement shown in Figure 38.11, the fluid is the conductor and the e.m.f. is detected by two electrodes placed across the diameter of the non-magnetic tube.

image

Thus with B and l known, when e is measured, the velocity of the fluid can be calculated.

Main advantages of electromagnetic flowmeters

(i) Unlike other methods, there is nothing directly to impede the fluid flow

(ii) There is a linear relationship between the fluid flow and the induced e.m.f.

image

(iii) Flow can be metered in either direction by using a centre-zero measuring instrument

Applications of electromagnetic flowmeters are found in the measurement of speeds of slurries, pastes and viscous liquids, and they are also widely used in the water production, supply and treatment industry.

Hot-wire Anemometer

A simple hot-wire anemometer consists of a small piece of wire which is heated by an electric current and positioned in the air or gas stream whose velocity is to be measured. The stream passing the wire cools it, the rate of cooling being dependent on the flow velocity. In practice there are various ways in which this is achieved:

(i) If a constant current is passed through the wire, variation in flow results in a change of temperature of the wire and hence a change in resistance which may be measured by a Wheatstone bridge arrangement. The change in resistance may be related to fluid flow.

(ii) If the wire’s resistance, and hence temperature, is kept constant, a change in fluid flow results in a corresponding change in current which can be calibrated as an indication of the flow rate.

(iii) A thermocouple may be incorporated in the assembly, monitoring the hot wire and recording the temperature which is an indication of the air or gas velocity.

Advantages of the hot-wire anemometer

(a) Its size is small

(b) It has great sensitivity


Fluids in Motion.

Fluids in Motion

Bernoulli’s Equation

Bernoulli’s equation is the principle of the conservation of energy applied to fluids in motion:

image

All of the quantities on the left of each equation apply to a specified fixed point in the moving fluid:

p = pressure (gauge pressure unless otherwise specified)

w = specific weight (weight per unit volume)

v = velocity

g = acceleration due to gravity

Z = height above some specified datum

p = density

The two significant differences between this application of the principle of the conservation of energy and the application of the principle of solids in motion are:

(i) this application is to a steady process mass (or weight) flowing per second which has to be considered, instead of a given fixed mass or weight

(ii) a third form of energy, that is, pressure energy, must be considered; the corresponding form of energy in dealing with solids, strain energy, is only occasionally met.

Each of the terms in equation (1) represents energy per unit weight of fluid.

The basic unit of each term is the metre,image

The basic unit for pressure is the same as for stress, N/m2or pascal, Pa. Each term in the equation is called a head.

image

In practise, as with solids, some energy is lost, converted into heat. The elimination of this loss is an important aspect of the mechanics of fluids.

If a pipe is filled by moving liquid the volumetric rate of flow, V, i.e. the volume passing per second, must be the same at every section: V = A1v1 = A2v2 where A1 and v1 are the cross-sectional area and velocity at one selected section and A2 and v2 are area and velocity at a second section. The equation

A1v1 = A2v2 is called the equation of continuity.

The basic unit of volumetric rate of flow VP is m3/s which is a large unit. The smaller unit, litres per second, is often preferred.

image(For very low rates of flow, litres per minute units may be preferred).

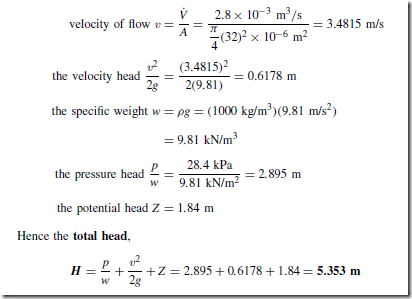
For example, let the rate of flow of water through a pipe of 32 mm diameter be 2.8 litre/s. The total head at a point where the pressure is 28.4 kPa with reference to a datum 1.84 m below is determined as follows:

image

Flow through Orifices

Water issuing from a tank as a horizontal jet, as shown in Figure 37.1, has a velocity head only, if the datum is taken at the level of orifice. Water, which will eventually form the jet, starts at the top of the tank with a potential head only, h. Equating initial potential and final velocity heads:

image

image

For example, an orifice in the bottom of a water tank has a diameter of

12.3 mm. Assuming coefficients of contraction and velocity of 0.64 and 0.96 respectively, the depth of water required in the tank to give a rate of discharge through the orifice of 0.25 litres per second is determined as follows:

The theoretical rate of discharge from the tank,

image

image

Impact of a Jet

The force exerted by a jet of water on a plate is, from Newton’s third law of motion, equal and opposite to the force exerted by the plate on the water. From Newton’s second law, this is equal to the rate of change of momentum of water.

image

In the case of the jet striking a flat plate at right angles, as in Figure 37.2, the final velocity in the original direction is zero, so that v is the change of velocity in this direction. Also, if d is the diameter of the jet:

image

image

The force will be in newtons if the jet diameter is in metres, the jet velocity in metres per second and density in kilograms per metre cubed and mass flow rate M in kg/s.

For example, let a jet of water with a diameter of 12.5 mm and a velocity of 40 m/s strike a stationery flat plate at right angles.

Mass rate of flow,

image


Surface Tension and Viscosity

Surface Tension and Viscosity

Surface Tension

The force of attraction between molecules in a liquid gives rise to what is termed surface tension.

The surface tension g of a liquid is the force per unit length acting in the surface perpendicular to one side of a line in the surface.

The free surface energy s is the energy required to create an additional unit area against the attractive forces of the molecules. The surface tension y and the free surface energy s are numerically the same, as shown below.

Consider a wire frame as shown in Figure 36.1 on which there is a soap film. XY is a sliding wire. The length of soap film in contact with the sliding wire is l. The force F due to surface tension on the wire XY is 2yl, the factor 2 occurring because there are two surfaces to the soap film. y is the surface tension of the soap film. If the wire is moved a distance x to the right, the work done against the force of surface tension is 2ylx.

Thus the increase in the surface tension is 2lx. Hence the energy required to create an additional unit area of film is: image

But this is the definition of free surface energy o-. Thus o- D y numerically. Because of differences between the cohesive force between molecules of liquid and the adhesive force between molecules of liquids and molecules of solids, a liquid surface is usually curved where it makes contact with a solid.

For example, the surface of water in a glass tube is concave and the surface of mercury in a glass tube is convex, as shown in Figure 36.2 The angle of contact () is defined as the angle between the solid surface and the tangent to the liquid surface. () is measured through the liquid as shown in Figure 36.3. If ( ) < 90° the liquid is said to ‘wet’ the solid surface.

Liquids for which ( ) < 90° rise in a tube with a small internal diameter (such as a capillary tube). Figure 36.4 shows a liquid that has risen a height h up a capillary tube of radius r.

The force due to the surface tension acting on the meniscus depends upon the circumference of the meniscus and the surface tension y.

image

image

image

For example, if the surface tension of mercury at 20 °C is 0.465 NmŁ1 and its angle of contact with glass is 140° , the capillary rise h of the mercury in a capillary tube of internal radius 2 mm is given by:

image

(The negative sign indicates that the mercury level in the capillary tube falls).

Excess Pressure

It may be shown that there is a pressure inside a spherical drop of liquid that exceeds the surrounding air pressure by an amount equal to imagewhere R is the radius of the drop. This is called the excess pressure.

For a spherical drop of liquid in air the excess pressure is  image

(ii) For a bubble of gas in a liquid the excess pressure is image

(iii) For a soap bubble in air the excess pressure is image

Energy Needed to Break Intermolecular Bond

From a knowledge of the free surface energy of a liquid an approximate value of the energy needed to break an intermolecular bond may be found. A molecule moving to the surface of a liquid as a new surface is created has its number of near neighbours decreased from ten to five. If n is the number of molecules per unit area of surface, thenimage bonds are broken for each unit area of surface produced and imageis the energy needed if ε is the energy required to break one bond. Thus, as o-, the force surface energy, is the energy required to produce unit area of surface, we have: image

Molar Latent Heat of Vaporisation

The molar latent heat of vaporisation of a substance is the energy required to evaporate 1 mole of the substance at standard pressure. If a solid that has a hexagonal close packed crystal structure is considered, each atom has twelve near neighbours. In the liquid form each atom has about ten near neighbours and bonds must be broken as the solid turns into a liquid and loses two near neighbours per atom. A vapour has no near neighbours and thus the liquid loses ten near neighbours per atom in evaporating.

In one mole there are 6 ð 1023 atoms and thus if each atom has ten near neighbours the number of bonds that need to be broken is:

image

The divisor of 2 is present because each bond connects two atoms. Thus, the molar latent heat is 5NAε, where NA is the number of atoms in a mole, i.e.

image

Therefore liquids with high values of o- should have high values of molar latent heat of vaporisation. This is reasonably confirmed by experiment.

Viscosity

Liquids (and gases) in contact with a solid surface stick to that surface. If a liquid flows on a solid surface we can consider the liquid to consist of layers. The bottom layer remains in contact with the solid and at rest. The other layers slide on one another and travel with velocities that increase the further the layer is from the solid, as shown in Figure 36.5. This is a description of streamline flow. If the velocity increases to beyond a critical value the flow becomes turbulent and the description in terms of layers no longer applies. In Figure 36.5, the arrows indicate the velocities of different layers. This condition will exist when the liquid is subjected to a shear force. The opposition to this is called the viscosity of the liquid.

Consider two parallel layers of liquid separated by a distance y travelling at velocities v and v C y. The lower layer tends to impede the flow of the upper layer and exerts a retarding force F on it, whereas the lower layer itself experiences an accelerating force F exerted on it by the upper layer.

image

The tangential stress between the two layers is F/A where A is the area of contact between the layers. The ratio image is called the velocity gradient.

Newton realised that for some fluids:

Tangential stress ˛ velocity gradient, and thus, imageconstant called the coefficient of viscosity. Thus,

image

Poiseulle’s Formula

Poiseulle’s formula for streamline flow through a circular pipe gives an expression for the volume V of liquid passing per second:

image

where r is the radius of the pipe, p is the pressure difference between the ends of the pipe, l is the length of the pipe and rJ is the coefficient of viscosity of the liquid.

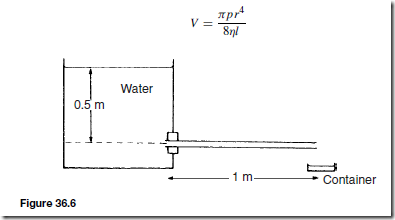
For example, in Figure 36.6 water flows from a tank through a tube of length 1 m and internal radius 2 mm. If the viscosity of water is mŁ1sŁ1, the rate at which water is collected in the small container is determined as follows:

From Poiseulle’s formula the volume collected per second, V, is given by:

image

where the pressure difference between the ends of the tube,

image

This rate will not be maintained because the water level in the tank will fall and pressure p will decrease.

Stoke’s Law

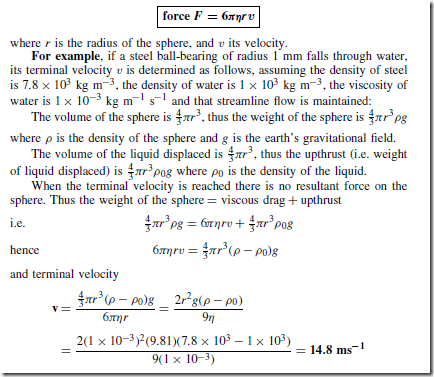
Stoke’s law gives an expression for the force F due to viscosity acting on a sphere moving with streamline flow through a liquid, i.e.

image


Surface Tension and Viscosity

Surface Tension and Viscosity

Surface Tension

The force of attraction between molecules in a liquid gives rise to what is termed surface tension.

The surface tension g of a liquid is the force per unit length acting in the surface perpendicular to one side of a line in the surface.

The free surface energy s is the energy required to create an additional unit area against the attractive forces of the molecules. The surface tension y and the free surface energy s are numerically the same, as shown below.

Consider a wire frame as shown in Figure 36.1 on which there is a soap film. XY is a sliding wire. The length of soap film in contact with the sliding wire is l. The force F due to surface tension on the wire XY is 2yl, the factor 2 occurring because there are two surfaces to the soap film. y is the surface tension of the soap film. If the wire is moved a distance x to the right, the work done against the force of surface tension is 2ylx.

Thus the increase in the surface tension is 2lx. Hence the energy required to create an additional unit area of film is: image

But this is the definition of free surface energy o-. Thus o- D y numerically. Because of differences between the cohesive force between molecules of liquid and the adhesive force between molecules of liquids and molecules of solids, a liquid surface is usually curved where it makes contact with a solid.

For example, the surface of water in a glass tube is concave and the surface of mercury in a glass tube is convex, as shown in Figure 36.2 The angle of contact () is defined as the angle between the solid surface and the tangent to the liquid surface. () is measured through the liquid as shown in Figure 36.3. If ( ) < 90° the liquid is said to ‘wet’ the solid surface.

Liquids for which ( ) < 90° rise in a tube with a small internal diameter (such as a capillary tube). Figure 36.4 shows a liquid that has risen a height h up a capillary tube of radius r.

The force due to the surface tension acting on the meniscus depends upon the circumference of the meniscus and the surface tension y.

image

image

image

For example, if the surface tension of mercury at 20 °C is 0.465 NmŁ1 and its angle of contact with glass is 140° , the capillary rise h of the mercury in a capillary tube of internal radius 2 mm is given by:

image

(The negative sign indicates that the mercury level in the capillary tube falls).

Excess Pressure

It may be shown that there is a pressure inside a spherical drop of liquid that exceeds the surrounding air pressure by an amount equal to imagewhere R is the radius of the drop. This is called the excess pressure.

For a spherical drop of liquid in air the excess pressure is  image

(ii) For a bubble of gas in a liquid the excess pressure is image

(iii) For a soap bubble in air the excess pressure is image

Energy Needed to Break Intermolecular Bond

From a knowledge of the free surface energy of a liquid an approximate value of the energy needed to break an intermolecular bond may be found. A molecule moving to the surface of a liquid as a new surface is created has its number of near neighbours decreased from ten to five. If n is the number of molecules per unit area of surface, thenimage bonds are broken for each unit area of surface produced and imageis the energy needed if ε is the energy required to break one bond. Thus, as o-, the force surface energy, is the energy required to produce unit area of surface, we have: image

Molar Latent Heat of Vaporisation

The molar latent heat of vaporisation of a substance is the energy required to evaporate 1 mole of the substance at standard pressure. If a solid that has a hexagonal close packed crystal structure is considered, each atom has twelve near neighbours. In the liquid form each atom has about ten near neighbours and bonds must be broken as the solid turns into a liquid and loses two near neighbours per atom. A vapour has no near neighbours and thus the liquid loses ten near neighbours per atom in evaporating.

In one mole there are 6 ð 1023 atoms and thus if each atom has ten near neighbours the number of bonds that need to be broken is:

image

The divisor of 2 is present because each bond connects two atoms. Thus, the molar latent heat is 5NAε, where NA is the number of atoms in a mole, i.e.

image

Therefore liquids with high values of o- should have high values of molar latent heat of vaporisation. This is reasonably confirmed by experiment.

Viscosity

Liquids (and gases) in contact with a solid surface stick to that surface. If a liquid flows on a solid surface we can consider the liquid to consist of layers. The bottom layer remains in contact with the solid and at rest. The other layers slide on one another and travel with velocities that increase the further the layer is from the solid, as shown in Figure 36.5. This is a description of streamline flow. If the velocity increases to beyond a critical value the flow becomes turbulent and the description in terms of layers no longer applies. In Figure 36.5, the arrows indicate the velocities of different layers. This condition will exist when the liquid is subjected to a shear force. The opposition to this is called the viscosity of the liquid.

Consider two parallel layers of liquid separated by a distance y travelling at velocities v and v C y. The lower layer tends to impede the flow of the upper layer and exerts a retarding force F on it, whereas the lower layer itself experiences an accelerating force F exerted on it by the upper layer.

image

The tangential stress between the two layers is F/A where A is the area of contact between the layers. The ratio image is called the velocity gradient.

Newton realised that for some fluids:

Tangential stress ˛ velocity gradient, and thus, imageconstant called the coefficient of viscosity. Thus,

image

Poiseulle’s Formula

Poiseulle’s formula for streamline flow through a circular pipe gives an expression for the volume V of liquid passing per second:

image

where r is the radius of the pipe, p is the pressure difference between the ends of the pipe, l is the length of the pipe and rJ is the coefficient of viscosity of the liquid.

For example, in Figure 36.6 water flows from a tank through a tube of length 1 m and internal radius 2 mm. If the viscosity of water is mŁ1sŁ1, the rate at which water is collected in the small container is determined as follows:

From Poiseulle’s formula the volume collected per second, V, is given by:

image

where the pressure difference between the ends of the tube,

image

This rate will not be maintained because the water level in the tank will fall and pressure p will decrease.

Stoke’s Law

Stoke’s law gives an expression for the force F due to viscosity acting on a sphere moving with streamline flow through a liquid, i.e.

image


Properties of Water and Steam

Properties of Water and Steam

Principle of Conservation of Energy

When two systems are at different temperatures, the transfer of energy from one system to the other is called heat transfer. For a block of hot metal cooling in air, heat is transferred from the hot metal to the cool air.

The principle of conservation of energy may be stated as

energy cannot be created nor can it be destroyed

and since heat is a form of energy, this law applies to heat transfer problems.

A more convenient way of expressing this law when referring to heat transfer problems is:

image

Internal Energy

Fluids consist of a very large number of molecules moving in random directions within the fluid. When the fluid is heated, the speeds of the molecules are increased, increasing the kinetic energy of the molecules. There is also an increase in volume due to an increase in the average distance between molecules, causing the potential energy of the fluid to increase. The internal energy, U, of a fluid is the sum of the internal kinetic and potential energies of the molecules of a fluid, measured in joules. It is not usual to state the internal energy of a fluid as a particular value in heat transfer problems, since it is normally only the change in internal energy that is required.

The amount of internal energy of a fluid depends on:

(a) the type of fluid; in gases the molecules are well separated and move with high velocities, thus a gaseous fluid has higher internal energy than the same mass of a liquid

(b) the mass of a fluid; the greater the mass, the greater the number of molecules and hence the greater the internal energy

(c) the temperature; the higher the temperature the greater the velocity of the molecules

Enthalpy

The sum of the internal energy and the pressure energy of a fluid is called the enthalpy of the fluid, denoted by the symbol H and measured in joules. The product of pressure p and volume V gives the pressure energy, or work done, i.e.

image

As for internal energy, the actual value of enthalpy is usually unimportant and it is the change in enthalpy that is usually required. In heat transfer problems involving steam and water, water is considered to have zero enthalpy at a standard pressure of 101 kPa and a temperature of 0°C. The word ‘specific’ associated with quantities indicates ‘per unit mass’. Thus the specific enthalpy is obtained by dividing the enthalpy by the mass and is denoted by the symbol h. Thus:

image

The units of specific enthalpy are joules per kilogram (J/kg)

For example, in a closed system, that is, a system in which the mass of fluid remains a constant, the internal energy changes from 25 kJ to 50 kJ and the work done by the system is 55 kJ. The heat transferred to the system to effect this change is given by:

image

That is, the heat transferred to the system is 80 kJ

Sensible Heat

The specific enthalpy of water, hf , at temperature 8°C is the quantity of heat needed to raise 1 kg of water from 0°C to 8°C, and is called the sensible heat of the water. Its value is given by:

specific heat capacity of water (c) x temperature change

image

The specific heat capacity of water varies with temperature and pressure but is normally taken as 4.2 kJ/kg, thus

image

Saturated Steam

When water is heated at a uniform rate, a stage is reached (at 100° C at standard atmospheric pressure) where the addition of more heat does not result in a corresponding increase in temperature. The temperature at which this occurs is called the saturation temperature, tSAT , and the water is called saturated water. As heat is added to saturated water, it is turned into saturated steam. The amount of heat required to turn 1 kg of saturated water into saturated steam is called the specific latent heat of vaporisation, and is given the symbol, hfg . The total specific enthalpy of steam at saturation temperature, hg , is given by:

the specific sensible heat  +  the specific latent heat of vaporization

image

Dryness Factor

If the amount of heat added to saturated water is insufficient to turn all the water into steam, then the ratio:

image

is called the dryness fraction of the steam, denoted by the symbol q. The steam is called wet steam and its total enthalpy h is given by:

image

Superheated Steam

When the amount of heat added to water at saturation temperature is sufficient to turn all the water into steam, it is called either saturated vapour or dry saturated steam. The addition of further heat results in the temperature of the steam rising and it is then called superheated steam. The specific enthalpy of superheated steam above that of dry saturated steam is given by:

c(tSUP Ł tSAT), where c is the specific heat capacity of the steam and tSUP is the temperature of the superheated steam. The total specific enthalpy of the superheated steam is given by:

image

Temperature/Specific Enthalpy Graph

The relationship between temperature and specific enthalpy can be shown graphically and a typical temperature/specific enthalpy diagram is shown in Figure 35.1. In this figure, AB represents the sensible heat region where any increase in enthalpy results in a corresponding increase in temperature. BC is called the evaporation line and points between B and C represent the wet steam region (or latent region), point C representing dry saturated steam. Points to the right of C represent the superheated steam region.

image

Steam Tables

The boiling point of water, tSAT and the various specific enthalpies associated with water and steam [hf , hfg and c(tSUP Ł tSAT)] all vary with pressure. These values at various pressures have been tabulated in steam tables, extracts from these being shown in Tables 35.1 and 35.2

In Table 35.1, the pressure in both bar and kilopascals, and saturated water temperature, are shown in columns on the left. The columns on the right give the corresponding specific enthalpies of water (hf) and dry sat- urated steam (hg ), together with the specific enthalpy of the latent heat of vaporization (hfg ). The columns on the right of Table 35.2 give the specific

image

image

enthalpies of dry saturated steam (hg) and superheated steam at various temperatures. The values stated refer to zero enthalpy. However, if the degree of superheat is given, this refers to the saturation temperature. Thus at a pressure of 100 kPa, the column headed, say, 250° C has a degree of superheat of (250 Ł 99.6)°C, that is 150.4° C.

For example, let some dry saturated steam at a pressure of 1.0 MPa be cooled at constant pressure until it has a dryness fraction of 0.6. The change in the specific enthalpy of the steam is determined as follows:

From Table 35.1, the specific enthalpy of dry saturated steam hg , at a pressure of 1.0 MPa (i.e. 1000 kPa) is 2778 kJ/kg. From earlier, the specific enthalpy of wet steam is hf C qhfg . At a pressure of 1.0 MPa, hf is 763 kJ/kg and hfg is 2015 kJ/kg. Thus, the specific enthalpy of the wet steam is given by:

image

Superheated steam behaves very nearly as if it is an ideal gas and the gas laws introduced in Chapter 34 may be used to determine the relationship between pressure, volume and temperature.