Microelectronics: Fabrication of Ic Devices.

FABRICATION OF IC DEVICES

Fabrication of monolithic ICs is the most complex aspect of microelectronic devices we will discuss. Therefore, in this introductory module, we will try to simplify this process as much as possible. Even though the discussion is very basic, the intent is still to increase your appreciation of the progress in microelectronics. You should, as a result of this discussion, come to realize that advances in manufacturing techniques are so rapid that staying abreast of them is extremely difficult.

Monolithic Fabrication.

Two types of monolithic fabrication will be discussed. These are the DIFFUSION METHOD and the EPITAXIAL METHOD.

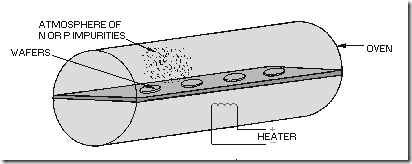
DIFFUSION METHOD.—The DIFFUSION process begins with the highly polished silicon wafer being placed in an oven (figure 1-11). The oven contains a concentration impurity made up of impurity atoms which yield the desired electrical characteristics. The concentration of impurity atoms is diffused into the wafer and is controlled by controlling the temperature of the oven and the time that the silicon wafer is allowed to remain in the oven. This is called DOPING. When the wafer has been uniformly doped, the fabrication of semiconductor devices may begin. Several hundred circuits are produced simultaneously on the wafer.

clip_image001

Figure 1-11.—Wafers in a diffusion oven.

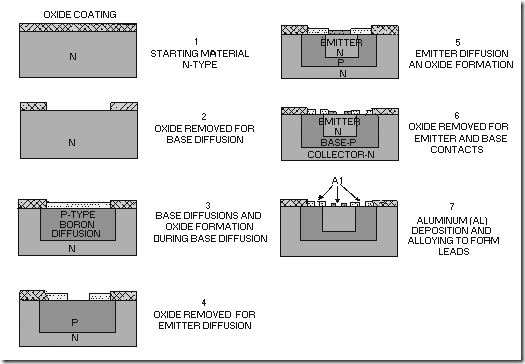
The steps in the fabrication process described here, and illustrated in figure 1-12, would produce an npn, planar-diffused transistor. But, with slight variations, the technique may also be applied to the production of a complete circuit, including diodes, resistors, and capacitors. The steps are performed in the following order:

clip_image002

Figure 1-12.—Planar-diffused transistor.

1. An oxide coating is thermally grown over the n-type silicon starting material.

2. By means of the photolithographic process, a window is opened through the oxide layer. This is done through the use of masks, as discussed earlier.

3. The base of the transistor is formed by placing the wafer in a diffusion furnace containing a p- type impurity, such as boron. By controlling the temperature of the oven and the length of time that the wafer is in the oven, you can control the amount of boron diffused through the window (the boron will actually spread slightly beyond the window opening). A new oxide layer is then allowed to form over the area exposed by the window.

4. A new window, using a different mask much smaller than the first, is opened through the new oxide layer.

5. An n-type impurity, such as phosphorous, is diffused through the new window to form the emitter portion of the transistor. Again, the diffused material will spread slightly beyond the window opening. Still another oxide layer is then allowed to form over the window.

6. By means of precision-masking techniques, very small windows (about 0.005 inch in diameter) are opened in both the base and emitter regions of the transistor to provide access for electrical currents.

7. Aluminum is then deposited in these windows and alloyed to form the leads of the transistor or the IC.

(Note that the pn junctions are covered throughout the fabrication process by an oxide layer that prevents contamination.)

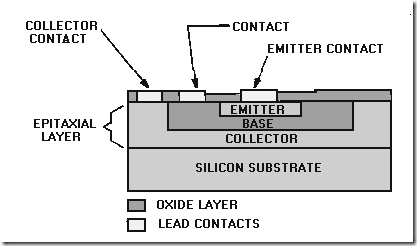
EPITAXIAL METHOD.—The EPITAXIAL process involves depositing a very thin layer of silicon to form a uniformly doped crystalline region (epitaxial layer) on the substrate. Components are produced by diffusing appropriate materials into the epitaxial layer in the same way as the planar- diffusion method. When planar-diffusion and epitaxial techniques are combined, the component characteristics are improved because of the uniformity of doping in the epitaxial layer. A cross section of a typical planar-epitaxial transistor is shown in figure 1-13. Note that the component parts do not penetrate the substrate as they did in the planar-diffused transistor.

clip_image003

Figure 1-13.—Planar-epitaxial transistor.

ISOLATION.—Because of the closeness of components in ICs, ISOLATION from each other becomes a very important factor. Isolation is the prevention of unwanted interaction or leakage between components. This leakage could cause improper operation of a circuit.

Techniques are being developed to improve isolation. The most prominent is the use of silicon oxide, which is an excellent insulator. Some manufacturers are experimenting with single-crystal silicon grown on an insulating substrate. Other processes are also used which are far too complex to go into here. With progress in isolation techniques, the reliability and efficiency of ICs will increase rapidly.

Thin Film

Thin film is the term used to describe a technique for depositing passive circuit elements on an insulating substrate with coating to a thickness of 0.0001 centimeter. Many methods of thin-film deposition exist, but two of the most widely used are VACUUM EVAPORATION and CATHODE SPUTTERING.

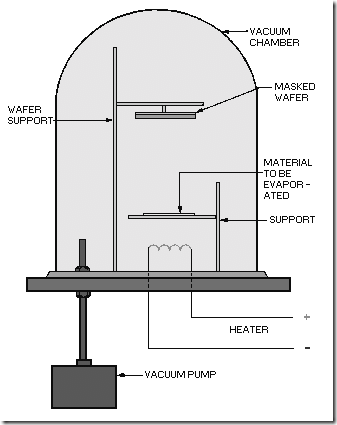
VACUUM EVAPORATION.—Vacuum evaporation is a method used to deposit many types of materials in a highly evacuated chamber in which the material is heated by electricity, as shown in figure 1-14. The material is radiated in straight lines in all directions from the source and is shadowed by any objects in its path.

clip_image004

Figure 1-14.—Vacuum evaporation oven.

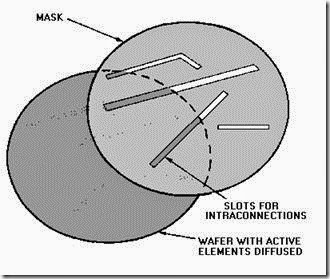
The wafers, with appropriate masks (figure 1-15), are placed above and at some distance from the material being evaporated. When the process is completed, the vacuum is released and the masks are removed from the wafers. This process leaves a thin, uniform film of the deposition material on all parts of the wafers exposed by the open portions of the mask. This process is also used to deposit interconnections (leads) between components of an IC.

clip_image006

Figure 1-15.—Evaporation mask.

The vacuum evaporation technique is most suitable for deposition of highly reactive materials, such as aluminum, that are difficult to work with in air. The method is clean and allows a better contact between the layer of deposited material and the surface upon which it has been deposited. In addition, because evaporation beams travel in straight lines, very precise patterns may be produced.

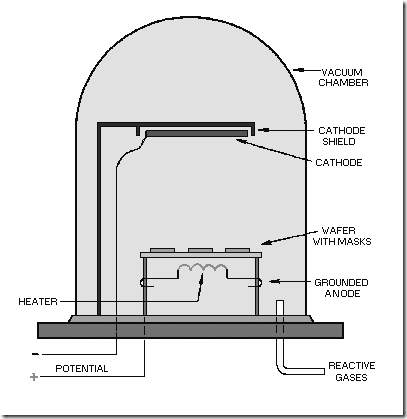
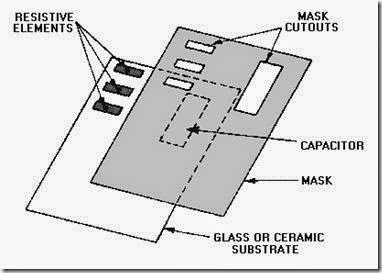
CATHODE-SPUTTERING.—A typical cathode-sputtering system is illustrated in figure 1-16. This process is also performed in a vacuum. A potential of 2 to 5 kilovolts is applied between the anode and cathode (source material). This produces a GLOW DISCHARGE in the space between the electrodes. The rate at which atoms are SPUTTERED off the source material depends on the number of ions that strike it and the number of atoms ejected for each ion bombardment. The ejected atoms are deposited uniformly over all objects within the chamber. When the sputtering cycle is completed, the vacuum in the chamber is released and the wafers are removed. The masks are then removed from the wafers, leaving a deposit that forms the passive elements of the circuit, as shown in figure 1-17.

clip_image007

Figure 1-16.—Cathode-sputtering system.

clip_image009

Figure 1-17.—Cathode-sputtering mask.

Finely polished glass, glazed ceramic, and oxidized silicon have been used as substrate materials for thin films. A number of materials, including nichrome, a compound of silicon oxide and chromium cermets, tantalum, and titanium, have been used for thin-film resistors. Nichrome is the most widely used.

The process for producing thin-film capacitors involves deposition of a bottom electrode, a dielectric, and finally a top electrode. The most commonly used dielectric materials are silicon monoxide and silicon dioxide.

Thick Film

Thick films are produced by screening patterns of conducting and insulating materials on ceramic substrates. A thick film is a film of material with a thickness that is at least 10 times greater than the mean free path of an electron in that material, or approximately 0.001 centimeter. The technique is used to produce only passive elements, such as resistors and capacitors.

PROCEDURES.—One procedure used in fabricating a thick film is to produce a series of stencils called SCREENS. The screens are placed on the substrate and appropriate conducting or insulating materials are wiped across the screen. Once the conducting or insulating material has been applied, the screens are removed and the formulations are fired at temperatures above 600 degrees Celsius. This process forms alloys that are permanently bonded to the insulating substrate. To a limited extent, the characteristics of the film can be controlled by the firing temperature and length of firing time.

RESISTORS.—Thick-film resistance values can be held to a tolerance of ±10 percent. Closer tolerances are obtained by trimming each resistor after fabrication. Hundreds of different cermet formulations are used to produce a wide range of component parameters. For example, the material used for a 10-ohm-per-square resistor is quite different from that used for a 100-kilohm-per-square resistor.

CAPACITORS AND RESISTOR-CAPACITOR NETWORKS.—Capacitors are formed by a sequence of screenings and firings. Capacitors in this case consist of a bottom plate, intraconnections, a dielectric, and a top plate. For resistor-capacitor networks, the next step would be to deposit the resistor material through the screen. The final step is screening and firing of a glass enclosure to seal the unit.

Hybrid Microcircuit

A hybrid microcircuit is one that is fabricated by combining two or more circuit types, such as film and semiconductor circuits, or a combination of one or more circuit types and discrete elements. The primary advantage of hybrid microcircuits is design flexibility; that is, hybrid microcircuits can be designed to provide wide use in specialized applications, such as low-volume and high-frequency circuits.

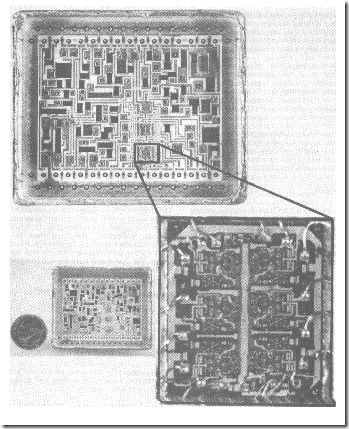
Several elements and circuits are available for hybrid applications. These include discrete components that are electrically and mechanically compatible with ICs. Such components may be used to perform functions that are supplementary to those of ICs. They can be handled, tested, and assembled with essentially the same technology and tools. A hybrid IC showing an enlarged chip is shown in figure 1-18.

clip_image010

Figure 1-18.—Hybrid IC showing an enlarged chip.

Complete circuits are available in the form of UNCASED CHIPS (UNENCAPSULATED IC DICE). These chips are usually identical to those sold as part of the manufacturer’s regular production line. They must be properly packaged and connected by the user if a high-quality final assembly is to be obtained. The circuits are usually sealed in a package to protect them from mechanical and environmental stresses. One-mil (0.001-inch), gold-wire leads are connected to the appropriate pins which are brought out of the package to allow external connections.

Q22. Name the two types of monolithic IC construction discussed.

Q23. How do the two types of monolithic IC construction differ? Q24. What is isolation?

Q25. What methods are used to deposit thin-film components on a substrate? Q26. How are thick-film components produced?

Q27. What is a hybrid IC?

Q28. What is the primary advantage of hybrid circuits?


Wave shaping: rl integrators and integrator waveform analysis.

RL INTEGRATORS

The RL circuit may also be used as an integrating circuit. An integrated waveform may be obtained from the series RL circuit by taking the output across the resistor. The characteristics of the inductor are such that at the first instant of time in which voltage is applied, current flow through the inductor is minimum and the voltage developed across it is maximum. Therefore, the value of the voltage drop across the series resistor at that first instant must be 0 volts because there is no current flow through it. As time passes, current begins to flow through the circuit and voltage develops across the resistor. Since the circuit has a long time constant, the voltage across the resistor does NOT respond to the rapid changes in voltage of the input square wave. Therefore, the conditions for integration in an RL circuit are a long time constant with the output taken across the resistor. These conditions are shown in figure 4-33.

image

Q20. What characteristic of an RL circuit allows it to act as an integrator?

INTEGRATOR WAVEFORM ANALYSIS

If either an RC or RL circuit has a time constant 10 times greater than the duration of the input pulse, the circuits are capable of integration. Let’s compute and graph the actual waveform that would result from a long time constant (10 times the pulse duration), a short time constant (1/10 of the pulse duration), and a medium time constant (that time constant between the long and the short). To accurately plot values for the capacitor output voltage, we will use the Universal Time Constant Chart shown in figure 4-34.

clip_image003

Figure 4-34.—Universal Time Constant Chart.

You already know that capacitor charge follows the shape of the curve shown in figure 4-34. This curve may be used to determine the amount of voltage across either component in the series RC circuit. As long as the time constant or a fractional part of the time constant is known, the voltage across either component may be determined.

Short Time-Constant Integrator

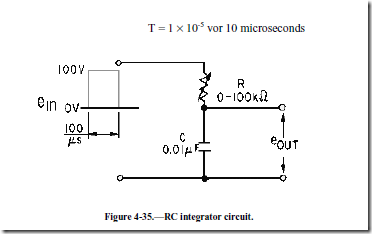
In figure 4-35, a 100-microsecond pulse at an amplitude of 100 volts is applied to the circuit. The circuit is composed of the, 0.01µF capacitor and the variable resistor, R. The square wave applied is a pure square wave. The resistance of the variable resistor is set at a value of 1,000 ohms. The time constant of the circuit is given by the equation:

image

image

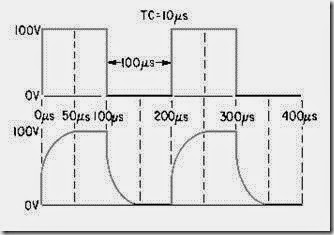
Since the time constant of the circuit is 10 microseconds and the pulse duration is 100 microseconds, the time constant is short (1/10 of the pulse duration). The capacitor is charged exponentially through the resistor. In 5 time constants, the capacitor will be, for all practical purposes, completely charged. At the first time constant, the capacitor is charged to 63.2 volts, at the second 86.5 volts, at the third 95 volts, at the fourth 98 volts, and finally at the end of the fifth time constant (50 microseconds), the capacitor is fully charged. This is shown in figure 4-36.

clip_image007

Figure 4-36.—Square wave applied to a short time-constant integrator.

Notice that the leading edge of the square wave taken across the capacitor is rounded. If the time constant were made extremely short, the rounded edge would become square.

Medium Time-Constant Integrator

The time constant, in figure 4-36 can be changed by increasing the value of the variable resistor (figure 4-35) to 10,000 ohms. The time constant will then be equal to 100 microseconds.

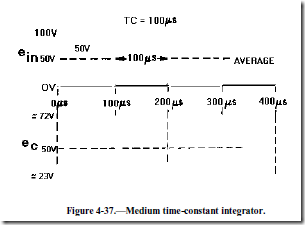
This time constant is known as a medium time constant. Its value lies between the extreme ranges of the short and long time constants. In this case, its value happens to be exactly equal to the duration of the input pulse, 100 microseconds. The output waveform, after several time constants, is shown in figure 4-37. The long, sloping rise and fall of voltage is caused by the inability of the capacitor to charge and discharge rapidly through the 10,000-ohm series resistance.

image

At the first instant of time, 100 volts is applied to the medium time-constant circuit. In this circuit, 1TC is exactly equal to the duration of the input pulse. After 1TC the capacitor has charged to 63.2 percent of the input voltage (100 volts). Therefore, at the end of 1TC (100 microseconds), the voltage across the capacitor is equal to 63.2 volts. However, as soon as 100 microseconds has elapsed, and the initial charge on the capacitor has risen to 63.2 volts, the input voltage suddenly drops to 0. It remains there for 100 microseconds. The capacitor will now discharge for 100 microseconds. Since the discharge time is 100 microseconds (1TC), the capacitor will discharge 63.2 percent of its total 63.2-volt charge, a value of 23.3 volts. During the next 100 microseconds, the input voltage will increase from 0 to 100 volts instantaneously. The capacitor will again charge for 100 microseconds (1TC). The voltage available for this charge is the difference between the voltage applied and the charge on the capacitor (100 – 23.3 volts), or 76.7 volts. Since the capacitor will only be able to charge for 1TC, it will charge to 63.2 percent of the 76.7 volts, or 48.4 volts. The total charge on the capacitor at the end of 300 microseconds will be 23.3 + 48.4 volts, or 71.7 volts.

Notice that the capacitor voltage at the end of 300 microseconds is greater than the capacitor voltage at the end of 100 microseconds. The voltage at the end of 100 microseconds is 63.2 volts, and the capacitor voltage at the end of 300 microseconds is 71.7 volts, an increase of 8.5 volts.

The output waveform in this graph (eC) is the waveform that will be produced after many cycles of input signal to the integrator. The capacitor will charge and discharge in a step-by-step manner until it finally charges and discharges above and below a 50-volt level. The 50-volt level is controlled by the maximum amplitude of the symmetrical input pulse, the average value of which is 50 volts.

Long Time-Constant Integrator

If the resistance in the circuit of figure 4-35 is increased to 100,000 ohms, the time constant of the circuit will be 1,000 microseconds. This time constant is 10 times the pulse duration of the input pulse. It is, therefore, a long time-constant circuit.

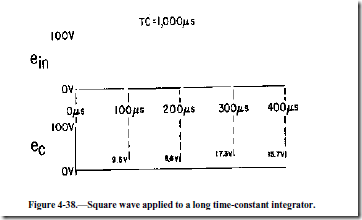
The shape of the output waveform across the capacitor is shown in figure 4-38. The shape of the output waveform is characterized by a long, sloping rise and fall of capacitor voltage.

image

At the first instant of time, 100 volts is applied to the long time-constant circuit. The value of charge on the capacitor at the end of the first 100 microseconds of the input signal can be found by using the Universal Time Constant Chart (figure 4-34). Assume that a line is projected up from the point on the base line corresponding to 0.1TC. The line will intersect the curve at a point that is the percentage of voltage across the capacitor at the end of the first 100 microseconds. Since the applied voltage is 100 volts, the charge on the capacitor at the end of the first 100 microseconds will be approximately 9.5 volts. At the end of the first 100 microseconds, the input signal will fall suddenly to 0 and the capacitor will begin to discharge. It will be able to discharge for 100 microseconds. Therefore, the capacitor will discharge 9.5 percent of its accumulated 9.5 volts (.095 ´ 9.5 = 0.90 volt). The discharge of the 0.90 volt will result in a remaining charge on the capacitor of 8.6 volts. At the end of 200 microseconds, the input signal will again suddenly rise to a value of 100 volts. The capacitor will be able to charge to 9.5 percent of the difference (100 – 8.6 = 91.4 volts). This may also be figured as a value of 8.7 volts plus the initial 8.6 volts. This results in a total charge on the capacitor (at the end of the first 300 microseconds) of 8.7 +8.6 = 17.3 volts.

Notice that the capacitor voltage at the end of the first 300 microseconds is greater than the capacitor voltage at the end of the first 100 microseconds. The voltage at the end of the first 100 microseconds is 9.5 volts; the capacitor voltage at the end of the first 300 microseconds is 17.3 volts, an increase of 7.8 volts.

The capacitor charges and discharges in this step-by-step manner until, finally, the capacitor charges and discharges above and below a 50-volt level. The 50-volt level is controlled by the maximum amplitude of the square-wave input pulse, the average value of which is 50 volts.

Q21. What is the numerical difference (in terms of the time constant) between a long and a short time- constant circuit?

Q22. What would happen to the integrator output if the capacitor were made extremely large (all other factors remaining the same)?


Answers to question and summary of wave shaping

SUMMARY

This chapter has presented information on wave shaping. The information that follows summarizes the important points of this chapter.

A LIMITER is a device which limits or prevents some part of a waveform from exceeding a specified value.

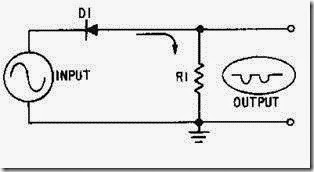
In a SERIES LIMITER, the diode is in series with the output. It can limit either the negative or positive alternation of the input signal.

In a SERIES-POSITIVE LIMITER, the diode is in series with the output which is taken across the resistor. It removes the positive alternation of the input signal.

clip_image002

In a SERIES-POSITIVE LIMITER WITH BIAS, the bias potential will either aid or oppose the flow of current. When aiding forward bias, only a portion of the positive input pulse is removed. When the bias aids the reverse bias, all of the positive and a portion of the negative pulse is removed.image

The SERIES-NEGATIVE LIMITER limits the negative portion of the input pulse. The difference between a series-negative limiter and a series-positive limiter is that the diode is reversed in the negative limiter.

clip_image006

A SERIES-NEGATIVE LIMITER with bias is the same as the series-positive limiter with bias, but the outputs are opposite. When bias aids forward bias, only a portion of the negative input is removed. When bias aids reverse bias, all of the negative and a portion of the positive input is removed.

clip_image008

In a PARALLEL LIMITER, a resistor and diode are connected in series with the input signal. The output is taken across the diode.

In the PARALLEL-POSITIVE LIMITER, the positive portion of the input signal is limited when the diode conducts.

clip_image010

The PARALLEL-NEGATIVE LIMITER diode is reversed from that of the parallel positive limiter to limit only a portion of the negative input signal.

clip_image012

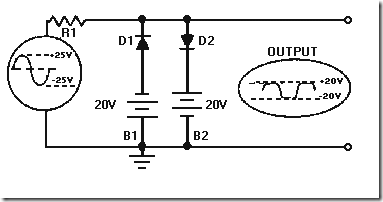
The DUAL-DIODE LIMITER combines the parallel negative limiter with negative bias (reverse bias) and the parallel positive limiter with positive bias (reverse bias). It will remove parts of the positive and negative input signal.

clip_image013

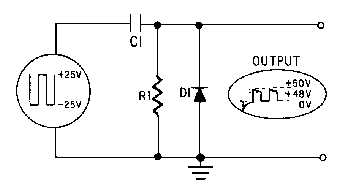
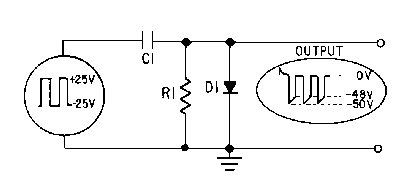
A CLAMPING CIRCUIT effectively clamps or ties down the upper or lower extremity of a waveform to a fixed dc potential. Clamping does not change the amplitude or shape of the input waveform.

image

A POSITIVE CLAMPER will clamp the lower extremity of the input waveform to a dc potential of 0 volts.

clip_image016

A NEGATIVE CLAMPER will clamp the upper extremity of the input waveform to a dc potential of 0 volts.

clip_image017

A COMMON-BASE TRANSISTOR CLAMPER clamps the collector voltage to a reference level. A waveform other than a sine wave is called a COMPLEX WAVE.

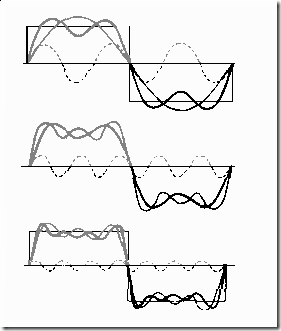
If the odd harmonics of a sine wave are added algebraically, the result is a square wave. A PERFECT SQUARE WAVE is composed of an infinite number of odd harmonics in phase with the fundamental wave.

clip_image018

A SAWTOOTH WAVE is made up of different harmonics, both odd and even.

clip_image020

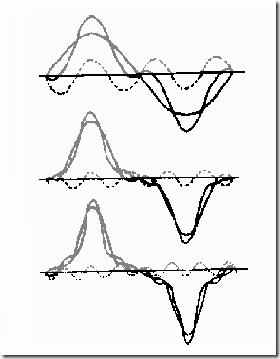
A PEAKED WAVE is made up of odd harmonics that are in phase and out of phase with the fundamental.

clip_image021

INTEGRATION takes place in an RC circuit with the output taken across the capacitor. The amount of integration is dependent upon the time constant of the circuit. Full integration takes place when the time constant of the RC circuit is at least 10 times greater than the duration of the input pulse. An RL circuit is also used as an integration circuit. The output is taken across the resistor and the time constant of the circuit is 10 times greater than the input pulse.

clip_image023

DIFFERENTIATION is the opposite of integration. In the differentiator, the output is taken across the resistor. Full differentiation takes place when the time constant of the circuit is 1/10 that of the input pulse.

clip_image025

A COUNTING CIRCUIT receives uniform pulses, representing units to be counted, and produces a voltage output proportional to its frequency.

ANSWERS TO QUESTION Q1. THROUGH Q27.

A1. Negative. A2. Positive. A3. Biasing. A4. The diode.

A5. Conducting, cutoff. A6. Short time constant. A7. Long time constant. A8. Most negative.

A9. Positive potential.

A10. Positive clamper with negative bias. A11. Most positive.

A12. Negative potential. A13. Positive bias. A14. -5 volts.

A15. It is composed of an infinite number of odd harmonics in phase with the fundamental. A16. It is composed of odd harmonics some of which are out phase with the fundamental.

A17. All the odd harmonics are in phase with the fundamental in the square wave. This is not true of the odd harmonics in the peaked wave.

A18. The time constant is long and the output is taken across the capacitor in an RC circuit. A19. A pure sine wave cannot be integrated; it contains no harmonics.

A20. The ability of the inductor to oppose a change in current.

A21. The time-constant value of a long time constant-circuit is 10 times the value of the input pulse duration. The short time-constant circuit has a time constant of 1/10 of the pulse duration.

A22. A more complete integration of the waveform would result from the long time constant.

A23. In an RC circuit the output is taken across the resistor. In the RL circuit the output is taken across the inductor.

A24. Frequency counters or frequency dividers. A25. The frequency of the voltage input.

A26. To provide a quick discharge path for C1.

A27. The load resistor in a positive counter is replaced by a capacitor in a step counter.


WAVE SHAPING:DIFFERENTIATORS AND COUNTERS.

DIFFERENTIATORS

DIFFERENTIATION is the direct opposite of integration. In the RC integrator, the output is taken from the capacitor. In the differentiator, the output is taken across the resistor. Likewise, this means that when the RL circuit is used as a differentiator, the differentiated output is taken across the inductor.

An application of Kirchhoff’s law shows the relationship between the waveforms across the resistor and capacitor in a series network. Since the sum of the voltage drops in a closed loop must equal the total applied voltage, the graphical sum of the voltage waveforms in a closed loop must equal the applied waveform. Figure 4-39 shows a differentiator circuit with the output taken across a variable resistor.

clip_image002[1]

Figure 4-39.—RC circuit as a differentiator.

Short Time-Constant Differentiator

With the variable resistor set at 1,000 ohms and the capacitor value of 0.01 microfarad, the time constant of the circuit is 10 microseconds. Since the input waveform has a duration of 100 microseconds, the circuit is a short time-constant circuit.

At the first instant of time in the short time-constant circuit, the voltage across the capacitor is 0. Current flows through the resistor and causes a maximum voltage to be developed across it. This is shown at the first instant of time in the graph of figure 4-40.

image

As the capacitor begins accumulating a charge, the voltage developed across the resistor will begin to decrease. At the end of the first time constant, the voltage developed across the resistor will have decreased by a value equal to 63.2 percent of the applied voltage. Since 100 volts is applied, the voltage across the resistor after 1TC will be equal to 36.8 volts. After the second time constant, the voltage across the resistor will be down to 13.5 volts. At the end of the third time constant, eR will be 5 volts and at the end of the fourth time constant, 2 volts. At the end of the fifth time constant, the voltage across the resistor will be very close to 0 volts. Since the time constant is equal to 10 microseconds, it will take a total of 50 microseconds to completely charge the capacitor and stop current flow in the circuit.

As shown in figure 4-40 the slope of the charge curve will be very sharp. The voltage across the resistor will remain at 0 volts until the end of 100 microseconds. At that time, the applied voltage suddenly drops to 0, and the capacitor will now discharge through the resistor. At this time, the discharge current will be maximum causing a large discharge voltage to develop across the resistor. This is shown as the negative spike in figure 4-40. Since the current flow from the capacitor, which now acts like a source, is decreasing exponentially, the voltage across the resistor will also decrease. The resistor voltage will decrease exponentially to 0 volts in 5 time constants. All of this discharge action will take a total of 50 microseconds. The discharge curve is also shown in figure 4-40. At the end of 200 microseconds, the action begins again. The output waveform taken across the resistor in this short time-constant circuit is an example of differentiation. With the square wave applied, positive and negative spikes are produced in the output. These spikes approximate the rate of change of the input square wave.

Medium Time-Constant Differentiator

The output across the resistor in an RC circuit of a medium time constant is shown in figure 4-41. The value of the variable resistor has been increased to a value of 10,000 ohms. This means that the time constant of the circuit is equal to the duration of the input pulse or 100 microseconds. For clarity, the voltage waveforms developed across both the resistor and the capacitor are shown. As before, the sum of the voltages across the resistor and capacitor must be equal to the applied voltage of 100 volts.

image

At the first instant of time, a pulse of 100 volts in amplitude with a duration of 100 microseconds is applied. Since the capacitor cannot respond quickly to the change in voltage, all of the applied voltage is felt across the resistor. Figure 4-41 shows the voltage across the resistor (eR) to be 100 volts and the voltage across the capacitor (eC) to be 0 volts. As time progresses, the capacitor charges. As the capacitor voltage increases, the resistor voltage decreases. Since the time that the capacitor is permitted to charge is 100 microseconds (equal to 1TC in this circuit), the capacitor will charge to 63.2 percent of the applied voltage at the end of 1TC, or 63.2 volts. Because Kirchhoff’s law must be followed at all times, the voltage across the resistor must be equal to the difference between the applied voltage and the charge on the capacitor (100 – 63.2 volts), or 36.8 volts.

At the end of the first 100 microseconds, the input voltage suddenly drops to 0 volts. The charge on the capacitor (-63.2 volts) becomes the source and the entire voltage is developed across the resistor for the first instant.

The capacitor discharges during the next 100 microseconds. The voltage across the resistor decreases at the same rate as the capacitor voltage and total voltage is maintained at 0. This exponential decrease in resistor voltage is shown during the second 100 microseconds in figure 4-41. The capacitor will discharge 63.2 percent of its charge to a value of 23.3 volts at the end of the second 100 microseconds. The resistor voltage will rise in the positive direction to a value of -23.3 volts to maintain the total voltage at 0 volts.

At the end of 200 microseconds, the input voltage again rises suddenly to 100 volts. Since the capacitor cannot respond to the 100-volt increase instantaneously, the 100-volt change takes place across the resistor. The voltage across the resistor suddenly rises from -23.3 volts to +76.7 volts. The capacitor will now begin to charge for 100 microseconds. The voltage will decrease across the resistor. This charge and discharge action will continue for many cycles. Finally, the voltage across the capacitor will rise and fall by equal amounts both above and below about a 50-volt level. The resistor voltage will also rise and fall by equal amounts to about a 0-volt level.

Long Time-Constant Differentiator

If the time constant for the circuit in figure 4-39 is increased to make it a long time-constant circuit, the differentiator output will appear more like the input. The time constant for the circuit can be changed by either increasing the value of capacitance or resistance. In this circuit, the time constant will be increased by increasing the value of resistance from 10,000 ohms to 100,000 ohms. Increasing the value of resistance will result in a time constant of 1,000 microseconds. The time constant is 10 times the duration of the input pulse. The output of this long time-constant circuit is shown in figure 4-42.

image

At the first instant of time, a pulse of 100-volts amplitude with a duration of 100 microseconds is applied. Since the capacitor cannot respond instantaneously to a change in voltage, all of the applied voltage is felt across the resistor. As time progresses, the capacitor will charge and the voltage across the resistor will be reduced. Since the time that the capacitor is permitted to charge is 100 microseconds, the capacitor will charge for only 1/10 of 1TC or to 9.5 percent of the applied voltage. The voltage across the resistor must be equal to the difference between the applied voltage and the charge on the capacitor (100 – 9.5 volts), or 90.5 volts.

At the end of the first 100 microseconds of input, the applied voltage suddenly drops to 0 volts, a change of 100 volts. Since the capacitor is not able to respond to so rapid a voltage change, it becomes the source of 9.5 volts. This causes a -9.5 voltage to be felt across the resistor in the first instant of time. The sum of the voltage across the two components is now 0 volts.

During the next 100 microseconds, the capacitor discharges. The total circuit voltage is maintained at 0 by the voltage across the resistor decreasing at exactly the same rate as the capacitor discharge. This exponential decrease in resistor voltage is shown during the second 100 microseconds of operation. The capacitor will now discharge 9.5 percent of its charge to a value of 8.6 volts. At the end of the second 100 microseconds, the resistor voltage will rise in a positive direction to a value of -8.6 volts to maintain the total circuit voltage at 0 volts.

At the end of 200 microseconds, the input voltage again suddenly rises to 100 volts. Since the capacitor cannot respond to the 100-volt change instantaneously, the 100-volt change takes place across the resistor. This step-by-step action will continue until the circuit stabilizes. After many cycles have passed, the capacitor voltage varies by equal amounts above and below the 50-volt level. The resistor voltage varies by equal amounts both above and below a 0-volt level.

The RC networks which have been discussed in this chapter may also be used as coupling networks. When an RC circuit is used as a coupling circuit, the output is taken from across the resistor. Normally, a long time-constant circuit is used. This, of course, will cause an integrated wave shape across the capacitor if the applied signal is nonsinusoidal. However, in a coupling circuit, the signal across the resistor should closely resemble the input signal and will if the time constant is sufficiently long. By referring to the diagram in figure 4-42, you can see that the voltage across the resistor closely resembles the input signal. Consider what would happen if a pure sine wave were applied to a long time-constant RC circuit (R is much greater than XC). A large percentage of the applied voltage would be developed across the resistor and only a small amount across the capacitor.

Q23. What is the difference between an RC and an RL differentiator in terms of where the output is developed?

COUNTERS

A counting circuit receives uniform pulses representing units to be counted. It provides a voltage that is proportional to the frequency of the units.

With slight modification, the counting circuit can be used with a blocking oscillator to produce trigger pulses which are a submultiple of the frequency of the pulses applied. In this case the circuit acts as a frequency divider.

The pulses applied to the counting circuit must be of the same time duration if accurate frequency division is to be made. Counting circuits are generally preceded by shaping circuits and limiting circuits (both discussed in this chapter) to ensure uniformity of amplitude and pulse width. Under those conditions, the pulse repetition frequency is the only variable and frequency variations may be measured.

Q24. Name a common application of counting circuits.

Positive Counters

The POSITIVE-DIODE COUNTER circuit is used in timing or counting circuits in which the number of input pulses are represented by the output voltage. The output may indicate frequency, count the rpm of a shaft, or register a number of operations. The counter establishes a direct relationship between the input frequency and the average dc output voltage. As the input frequency increases, the output voltage also increases; conversely, as the input frequency decreases, the output voltage decreases. In effect, the positive counter counts the number of positive input pulses by producing an average dc output voltage proportional to the repetition frequency of the input signal. For accurate counting, the pulse repetition frequency must be the only variable parameter in the input signal. Therefore, careful shaping and limiting of the input signal is essential for you to ensure that the pulses are of uniform width and that the amplitude is constant. When properly filtered and smoothed, the dc output voltage of the counter may be used to operate a direct reading indicator.

Solid-state and electron-tube counters operate in manners similar to each other. The basic solid-state (diode) counter circuit is shown in view (A) of figure 4-43. Capacitor C1 is the input coupling capacitor. Resistor R1 is the load resistor across which the output voltage is developed. For the purpose of circuit discussion, assume that the input pulses (shown in view (B)) are of constant amplitude and time duration and that only the pulse repetition frequency changes. At time T0, the positive-going input pulse is applied to C1 and causes the anode of D2 to become positive. D2 conducts and current ic flows through R1 and D2 to charge C1. Current ic, develops an output voltage across R1, shown as eout.

clip_image010[1]

Figure 4-43A.—Positive-diode counter and waveform.

clip_image012[1]

Figure 4-43B.—Positive-diode counter and waveform.

The initial heavy flow of current produces a large voltage across R1 which tapers off exponentially as C1 charges. The charge on C1 is determined by the time constant of R1 and the conducting resistance of the diode times the capacitance of C1. For ease of explanation, assume that C1 is charged to the peak value before T1.

At T1 the input signal reverses polarity and becomes negative-going. Although the charge on capacitor C1 cannot change instantly, the applied negative voltage is equal to or greater than the charge on C1. This causes the anode of D2 to become negative and conduction ceases. When D2 stops conducting e out is at 0. C1 quickly discharges through D1 since its cathode is now negative with respect to ground. Between T1 and T2 the input pulse is again at the 0-volt level and D2 remains in a nonconducting state. Since the very short time constant provided by the conduction resistance of D1 and C1 is so much less than the long time constant offered by D2 and R1 during the conduction period, C1 is always completely discharged between pulses. Thus, for each input pulse, a precise level of charge is deposited on C1. For each charge of C1 an identical output pulse is produced by the flow of ic through R1. Since this current flow always occurs in the direction indicated by the solid arrow, the dc output voltage is positive.

At T2 the input signal again becomes positive and the cycle repeats. The time duration between pulses is the interval represented by the period between T1 and T2 or between T3 and T4. If the input- pulse frequency is reduced, these time periods become longer. On the other hand, if the frequency is increased, these time intervals become shorter. With shorter periods, more pulses occur in a given length of time and a higher average dc output voltage is produced; with longer periods, fewer pulses occur and a lower average dc output voltage is produced. Thus, the dc output is directly proportional to the repetition frequency of the input pulses. If the current and voltage are sufficiently large, a direct-reading meter can be used to indicate the count. If they are not large enough to actuate a meter directly, a dc amplifier may be added. In the latter case, a pi-type filter network is inserted at the output of R1 to absorb the instantaneous pulse variations and produce a smooth direct current for amplification.

From the preceding discussion, you should see that the voltage across the output varies in direct proportion to the input pulse repetition rate. Hence, if the repetition rate of the incoming pulses increases, the voltage across R1 also increases. For the circuit to function as a frequency counter, some method must

be employed to use this frequency-to-voltage relationship to operate an indicator. The block diagram in view (A) of figure 4-44 represents one simple circuit which may be used to perform this function. In this circuit, the basic counter is fed into a low-pass filter and an amplifier with a meter that is calibrated in units of frequency.

clip_image014[1]

Figure 4-44.—Basic frequency counter.

A typical schematic diagram is shown in view (B). The positive pulses from the counter are filtered by C2, R2, and C3. The positive dc voltage from the filter is applied to the input of amplifier A. This voltage increases with frequency; as a consequence, the current through the device increases. Since emitter or cathode current flows through M1, an increase in amplifier current causes an increase in meter deflection. The meter may be calibrated in units of time, frequency, revolutions per minute, or any function based upon the relationship of output voltage to input frequency.

Q25. What establishes the value of the current that flows in the output of figure 4-43? Q26. What is the purpose of D1 in figure 4-43?

Negative Counters

Reversing the connections of diodes D1 and D2 in the positive-counter circuit (view (A) of figure 4-43) will cause the circuit to respond to negative pulses and become a negative-counter circuit. Diode D2 conducts during the time the negative pulse is applied and current flows in the opposite direction through R1, as was indicated by the arrow. At the end of the negative pulse, D1 conducts and discharges C1. The current through R1 increases with an increase in pulse frequency as before. However, if the voltage developed across R1 is applied to the same control circuit, as shown in view (A) of figure 4-44, the increase in current will be in a negative direction and the amplifier will conduct less. Thus, the effect is opposite to that of the positive counter.

Step-by-Step (Step) Counters

The STEP-BY-STEP (STEP) COUNTER is used as a voltage multiplier when a stepped voltage must be provided to any device which requires such an input. The step counter provides an output which increases in one-step increments for each cycle of the input. At some predetermined level, the output voltage reaches a point which causes a circuit, such as a blocking oscillator, to be triggered.

A schematic diagram of a positive step counter is shown in view (A) of figure 4-45. For step counting, the load resistor of the positive-counting circuit is replaced by capacitor C2. This capacitor is relatively large in comparison to C1. Each time D2 conducts, the charge on C2 increases as shown in view (B). The steps are not the same height each time. They decrease exponentially with time as the voltage across C2 approaches the input voltage.

clip_image016[1]

Figure 4-45A.—Basic step counter and waveforms.

clip_image018[1]

Figure 4-45B.—Basic step counter and waveforms.

As long as C2 has no discharge path, the voltage across its terminals increases with each successive step until it is equal in amplitude to the applied pulse. The voltage across C2 could be applied to a blocking-oscillator circuit to cause the oscillator to pulse after a certain amount of voltage is applied to it.

The circuit in figure 4-46, (view A) and (view B), may be used as a frequency divider. When used in this manner, Q1 is used as a single-swing blocking oscillator that is triggered when the voltage across C2 becomes great enough to forward bias Q1. At other times, the transistor is cut off by the bias voltage developed in the section of R2 that is between the ground and the slide.

clip_image020[1]

Figure 4-46A.—Step counter as a frequency divider and waveforms.

clip_image022[1]

Figure 4-46B.—Step counter as a frequency divider and waveforms.

The action of the counter can best be understood by referring back to figure 4-45. Assume C2 is 10 times larger than C1 and the peak voltage is 10 volts. C1 will assume 9/10 of the positive input voltage at T0, while C2 will assume only 1/10, or 1 volt in this example. At T1 the input will drop in a negative direction and D2 will be cut off. The cathode of D1 will become more negative than its anode and conduct, discharging C1. The charge on C2 will remain at 1 volt because it has no discharge path. At T2 the second pulse will be applied. The 1-volt charge on C2 will oppose the 10 volts of the second pulse, and the applied voltage for the capacitors to charge will be 9 volts. C2 will again charge 10 percent, or 0.9 volt. This is in addition to the initial charge of volt. At the end of the second pulse, the voltage on C2 will be 1.9 volts. At T3 the third pulse will be 10 volts, but 1.9 volts will oppose it. Therefore, the applied voltage will be 10 – 1.9 volts, or 8.1 volts. C2 will charge to 10 percent of 8.1 volts, or .81 volt. The voltage on C2 will become 1 + .9 + .81, or 2.71 volts. Successive input pulses will raise C2 by 10 percent of the remaining voltage toward 10 volts until the blocking oscillator works. If the oscillator bias is set so that Q1 begins conduction at 3.8 volts, this will continue until 3.8 volts is exceeded. Since the fourth step is 3.5 volts and the fifth is 4.1 volts, the 3.8-volt level is crossed at the fifth step. If the oscillator goes through 1 cycle of operation every fifth step and C2 is discharged at this point, this circuit would be a 5- to-1 divider.

The circuit can be made to divide by 3, 4, or some other value by setting the bias at a different level. For example, if the bias is set at 2.9 volts, conduction will occur at the fourth step, making it a 4-to-1 divider.

The counting stability of the step counter is dependent upon the exponential charging rate of capacitor C2. As C2 increases to higher steps, the voltage increments are less and less. If the ratio becomes too great, the higher steps become almost indiscernible. For this reason, accuracy decreases as the ratio increases. When you desire to count by a large number, 24 for example, a 6-to-1 counter and a 4- to-1 counter are connected in cascade (series). A more stable method of counting 24 would be to use a 2:1, 3:1, 4:1 counter connected in cascade. Most step counters operate on a ratio of 5 to 1 or less.

Q27. What is the difference between a positive counter and a step counter?


Wave shaping: parallel limiters.

PARALLEL LIMITERS

A PARALLEL-LIMITER circuit uses the same diode theory and voltage divider action as series limiters. A resistor and diode are connected in series with the input signal and the output signal is developed across the diode. The output is in parallel with the diode, hence the circuit name, parallel limiter. The parallel limiter can limit either the positive or negative alternation of the input signal.

Recall that in the series limiter the output was developed while the diode was conducting. In the parallel limiter the output will develop when the diode is cut off. You should not try to memorize the outputs of these circuits; rather, you should study their actions and be able to figure them out.

Parallel-Positive Limiter.

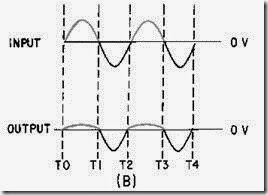
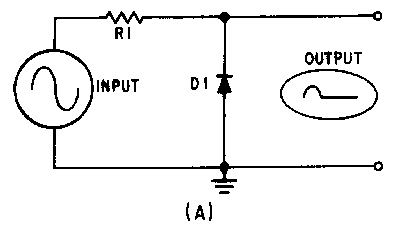
The schematic diagram shown in figure 4-9, view (A), is a PARALLEL-POSITIVE LIMITER. The diode is in parallel with the output and only the positive half cycle of the input is limited. When the positive alternation of the input signal is applied to the circuit (T0 to T1), the diode is forward biased and conducts. This action may be seen in view (B). As current flows up through the diode and the resistor, a voltage is dropped across each. Since R1 is much larger than the forward resistance of D1, most of the input signal is developed across R1. This leaves only a very small voltage across the diode (output). The positive alternation of the input signal has been limited.

clip_image002

Figure 4-9A.—Parallel-positive limiter.

clip_image004

Figure 4-9B.—Parallel-positive limiter.

From T1 to T2 the diode is reverse biased and acts as an extremely high resistance. The negative alternation of the input signal appears across the diode at approximately the same amplitude as the input. The negative alternation of the input is not limited.

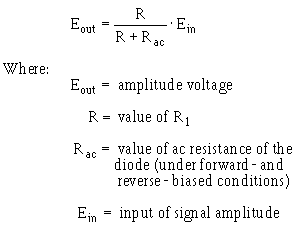
As with the series limiter, the parallel limiter should provide maximum output voltage for the unlimited part of the signal. The reverse-bias resistance of the diode must be very large compared to the series resistor. To determine the output amplitude, use the following formula:

clip_image005

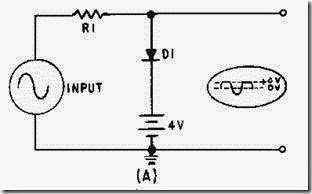
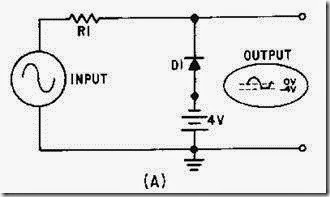
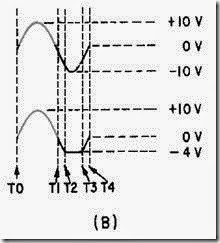
PARALLEL-POSITIVE LIMITER WITH BIAS.—Figure 4-10, view (A), shows the schematic diagram of a PARALLEL-POSITIVE LIMITER WITH NEGATIVE BIAS. The diode is forward biased and conducts without an input signal. D1 is essentially a short circuit. The voltage at the output terminals is -4 volts.

clip_image007

Figure 4-10A.—Parallel limiter with negative bias.

clip_image009

Figure 4-10B.—Parallel limiter with negative bias.

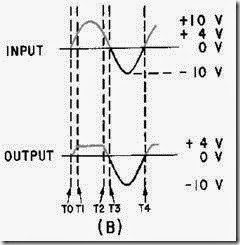
As the positive alternation of the input signal is applied to the circuit, the diode remains forward biased and limits the entire positive alternation, as shown in view (B). As the signal goes in a negative direction Oust before T1), the diode remains forward biased (limiting is still present) until the input signal

exceeds -4 volts (T1). D1 becomes reverse biased as the anode becomes more negative than the cathode. While the input signal is more negative than the -4 volts of the bias battery (T1 to T2), the diode is reverse biased and remains cut off. The output follows the input signal from T1 to T2. At all other times during that cycle, the diode is forward biased and limiting occurs. This circuit is called a parallel-positive limiter with negative bias because the positive output is limited and the bias in the circuit is negative with reference to ground. Limiting takes place at all points more positive than -4 volts.

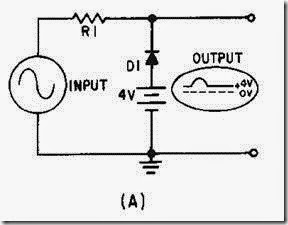
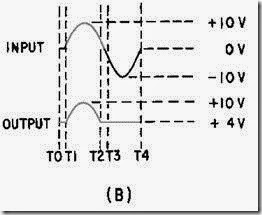
The circuit shown in figure 4-11, view (A), is a PARALLEL-POSITIVE LIMITER WITH POSITIVE BIAS. The positive terminal of the battery is connected to the cathode of the diode. This causes the diode to be reverse biased at all times except when the input signal is more positive than the bias voltage (T1 to T2), as shown in view (B).

clip_image011

Figure 4-11A.—Parallel-positive Limiter with positive bias.

clip_image013

Figure 4-11B.—Parallel-positive Limiter with positive bias.

As the positive alternation of the input signal is applied (T0), the output voltage follows the input signal. From T1 to T2 the input signal is more positive than + 4 volts. The diode is forward biased and conducts. At this time the output voltage equals the bias voltage and limiting takes place. From T2 to T4 of the input signal, the diode is reverse biased and does not conduct. The output signal follows the input signal and no limiting takes place.

This circuit is called a parallel-positive limiter with positive bias because limiting takes place in the positive alternation and positive bias is used on the diode.

Parallel-Negative Limiter

A PARALLEL-NEGATIVE LIMITER is shown in view (A) of figure 4-12. Notice the similarity of the parallel-negative limiter and the parallel-positive limiter shown in view (A) of figure 4-9. From T0 to T1 of the input signal, the diode is reverse biased and does not conduct, as shown in view (B) of figure

4-12. The output signal follows the input signal and the positive alternation is not limited.

clip_image014

Figure 4-12A.—Parallel-negative limiter.

clip_image016

Figure 4-12B.—Parallel-negative limiter.

During the negative alternation of the input signal (T1 to T2), the diode is forward biased and conducts. The relatively low forward bias of D1 develops a very small voltage and, therefore, limits the output to nearly 0 volts. A voltage is developed across the resistor as current flows through the resistor and diode.

PARALLEL-NEGATIVE LIMITER WITH BIAS.—The circuit shown in figure 4-13, view (A), is a parallel-negative limiter with negative bias. With no input, the battery maintains D1 in a reverse-bias condition. D1 cannot conduct until its cathode is more negative than its anode. D1 acts as an open until the input signal dips below -4 volts at T2 in view (B). At T2 the input signal becomes negative enough to forward bias the diode, D1 conducts and acts like a short, and the output is limited to the -4 volts from the battery from T2 to T3. Between T3 and T4 the diode is again reverse biased. The output signal follows the input signal and no limiting occurs.

clip_image018

Figure 4-13A.—Parallel-negative limiter with negative bias.

clip_image020

Figure 4-13B.—Parallel-negative limiter with negative bias.

Figure 4-14, view (A), shows a parallel-negative limiter with positive bias. The operation is similar to those circuits already explained. Limiting occurs when the diode conducts. No limiting occurs when the diode is reverse biased. In this circuit, the bias battery provides forward bias to the diode without an input signal. The output is at +4 volts, except where the input goes above +4 volts (T1 to T2), as shown in view (B). The parts of the signal more negative than +4 volts are limited.

clip_image022

Figure 4-14A.—Parallel-negative limiter with positive bias.

clip_image024

Figure 4-14B.—Parallel-negative limiter with positive bias.

Q4. What component is in parallel with the output in a parallel limiter?

Q5. What is the condition of the diode in a series limiter when an output is developed? In a parallel limiter?


Wave shaping: nonsinusoidal voltages applied to an rc circuit and rc integrators.

Nonsinusoidal Voltages Applied to an RC Circuit

The harmonic content of a square wave must be complete to produce a pure square wave. If the harmonics of the square wave are not of the proper phase and amplitude relationships, the square wave will not be pure. The term PURE, as applied to square waves, means that the waveform must be perfectly square.

Figure 4-28 shows a pure square wave that is applied to a series-resistive circuit. If the values of the two resistors are equal, the voltage developed across each resistor will be equal; that is, from one pure square-wave input, two pure square waves of a lower amplitude will be produced. The value of the resistors does not affect the phase or amplitude relationships of the harmonics contained within the square waves. This is true because the same opposition is offered by the resistors to all the harmonics presented. However, if the same square wave is applied to a series RC circuit, as shown in figure 4-29, the circuit action is not the same.

clip_image002

Figure 4-28.—Square wave applied to a resistive circuit.

clip_image004

Figure 4-29.—Square wave applied to an RC circuit.

RC INTEGRATORS

The RC INTEGRATOR is used as a waveshaping network in communications, radar, and computers. The harmonic content of the square wave is made up of odd multiples of the fundamental frequency. Therefore SIGNIFICANT HARMONICS (those that have an effect on the circuit) as high as 50 or 60 times the fundamental frequency will be present in the wave. The capacitor will offer a reactance (XC) of a different magnitude to each of the harmonics

clip_image005

This means that the voltage drop across the capacitor for each harmonic frequency present will not be the same. To low frequencies, the capacitor will offer a large opposition, providing a large voltage drop across the capacitor. To high frequencies, the reactance of the capacitor will be extremely small, causing a small voltage drop across the capacitor. This is no different than was the case for low- and high- pass filters (discriminators) presented in chapter 1. If the voltage component of the harmonic is not developed across the reactance of the capacitor, it will be developed across the resistor, if we observe Kirchhoff’s voltage law. The harmonic amplitude and phase relationship across the capacitor is not the same as that of the original frequency input; therefore, a perfect square wave will not be produced across the capacitor. You should remember that the reactance offered to each harmonic frequency will cause a change in both the amplitude and phase of each of the individual harmonic frequencies with respect to the current reference. The amount of phase and amplitude change taking place across the capacitor depends on the XC of the capacitor. The value of the resistance offered by the resistor must also be considered here; it is part of the ratio of the voltage development across the network.

The circuit in figure 4-30 will help show the relationships of R and XC more clearly. The square wave applied to the circuit is 100 volts peak at a frequency of 1 kilohertz. The odd harmonics will be 3 kilohertz, 5 kilohertz, 7 kilohertz, etc. Table 4-1 shows the values of XC and R offered to several

harmonics and indicates the approximate value of the cutoff frequency (XC = R). The table clearly shows that the cutoff frequency lies between the fifth and seventh harmonics. Between these two values, the capacitive reactance will equal the resistance. Therefore, for all harmonic frequencies above the fifth, the majority of the output voltage will not be developed across the output capacitor. Rather, most of the output will be developed across R. The absence of the higher order harmonics will cause the leading edge of the waveform developed across the capacitor to be rounded. An example of this effect is shown in figure 4-31. If the value of the capacitance is increased, the reactances to each harmonic frequency will be further decreased. This means that even fewer harmonics will be developed across the capacitor.

clip_image007

Figure 4-30.—Partial integration circuit.

clip_image009

Figure 4-31.—Partial integration.

image

The harmonics not effectively developed across the capacitor must be developed across the resistor to satisfy Kirchhoff’s voltage law. Note the pattern of the voltage waveforms across the resistor and capacitor. If the waveforms across both the resistor and the capacitor were added graphically, the resultant would be an exact duplication of the input square wave.

When the capacitance is increased sufficiently, full integration of the input signal takes place in the output across the capacitor. An example of complete integration is shown in figure 4-32 (waveform eC). This effect can be caused by significantly decreasing the value of capacitive reactance. The same effect would take place by increasing the value of the resistance. Integration takes place in an RC circuit when the output is taken across the capacitor..

image

The amount of integration is dependent upon the values of R and C. The amount of integration may also be dependent upon the time constant of the circuit. The time constant of the circuit should be at least 10 TIMES GREATER than the time duration of the input pulse for integration to occur. The value of 10 is only an approximation. When the time constant of the circuit is 10 or more times the value of the duration of the input pulse, the circuit is said to possess a long time constant. When the time constant is long, the capacitor does not have the ability to charge instantly to the value of the applied voltage. Therefore, the result is the long, sloping, integrated waveform.

Q18. What are the requirements for an integration circuit? Q19. Can a pure sine wave be integrated? Why?