Purely Resistive a.c. Circuit
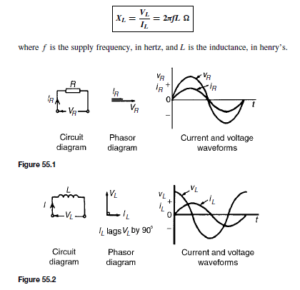
In a purely resistive a.c. circuit, the current IR and applied voltage VR are in phase. See Figure 55.1.
Purely Inductive a.c. Circuit
In a purely inductive a.c. circuit, the current IL lags the applied voltage VL by ![]() See Figure 55.2.
See Figure 55.2.
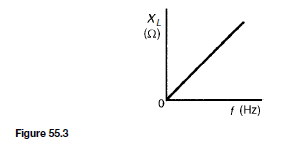
In a purely inductive circuit the opposition to the flow of alternating current is called the inductive reactance, XL
For example, if a coil has an inductance of 40 mH and negligible resistance and is connected to a 240 V, 50 Hz supply:
Purely Capacitive a.c. Circuit
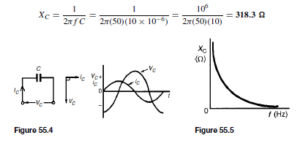
In a purely capacitive a.c. circuit, the current IC leads the applied voltage VC by 90° (i.e. JT/2 rads). See Figure 55.4.
In a purely capacitive circuit the opposition to the flow of alternating current is called the capacitive reactance, XC
where C is the capacitance in farads.
For example, the capacitive reactance of a capacitor of 10µF when connected to a circuit of frequency 50 Hz is given by: capacitive reactance,
If the frequency is, say, 20 kHz, then
XC varies with frequency f as shown in Figure 55.5.
R-L Series a.c. Circuit
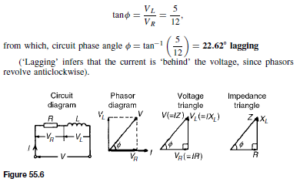
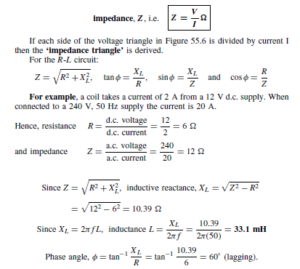
In an a.c. circuit containing inductance L and resistance R, the applied voltage V is the phasor sum of VR and VL (see Figure 55.6), and thus the current I lags the applied voltage V by an angle lying between 0° and 90° (depending on the values of VR and VL ), shown as angle ˇ. In any a.c. series circuit the current is common to each component and is thus taken as the reference phasor.
From the phasor diagram of Figure 55.6, the ‘voltage triangle’ is derived.
For example, in a series R-L circuit the p.d. across the resistance R is 12 V and the p.d. across the inductance L is 5 V
From the voltage triangle of Figure 55.6, supply voltage ![]()
(Note that in a.c. circuits, the supply voltage is not the arithmetic sum of the p.d’s across components. It is, in fact, the phasor sum).
In an a.c. circuit, the ratio applied voltage V to current I is called the
This example indicates a simple method for finding the inductance of a coil, i.e. firstly to measure the current when the coil is connected to a d.c. supply of known voltage, and then to repeat the process with an a.c. supply.
R–C Series a.c. Circuit
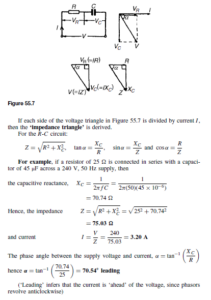
In an a.c. series circuit containing capacitance C and resistance R, the applied voltage V is the phasor sum of VR and VC (see Figure 55.7) and thus the current I leads the applied voltage V by an angle lying between 0° and 90° (depending on the values of VR and VC), shown as angle a
From the phasor diagram of Figure 55.7, the ‘voltage triangle’ is derived.
R-L-C series a.c. circuit
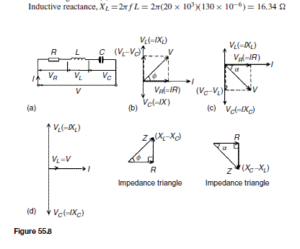
In an a.c. series circuit containing resistance R, inductance L and capacitance C, the applied voltage V is the phasor sum of VR , VL and VC (see Figure 55.8).
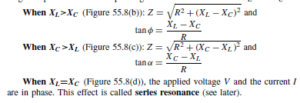
VL and VC are anti-phase, i.e. displaced by 180° , and there are three phasor diagrams possible — each depending on the relative values of VL and VC.
Series connected impedances
For series-connected impedances the total circuit impedance can be represented as a single L-C-R circuit by combining all values of resistance together, all values of inductance together and all values of capacitance together, (remembering that for series connected capacitors ![]()
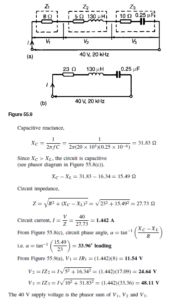
For example, the following three impedances are connected in series across a 40 V, 20 kHz supply: (i) a resistance of 8 Q, (ii) a coil of inductance 130 µH and 5 Q resistance, and (iii) a 10 Q resistor in series with a 0.25 µF capacitor. The circuit diagram is shown in Figure 55.9(a). Since the total circuit resistance is 8 C 5 C 10, i.e. 23 Q, an equivalent circuit diagram may be drawn as shown in Figure 55.9(b)
Series resonance
As stated earlier, for an R-L-C series circuit, when XL D XC (Figure 55.8(d)), the applied voltage V and the current I are in phase.
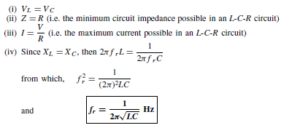
This effect is called series resonance. At resonance:
where fr is the resonant frequency.
(v) The series resonant circuit is often described as an acceptor circuit since it has its minimum impedance, and thus maximum current, at the resonant frequency.
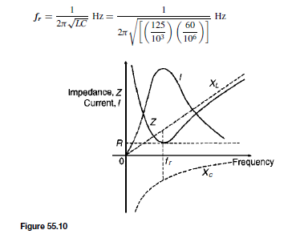
(vi) Typical graphs of current I and impedance Z against frequency are shown in Figure 55.10.
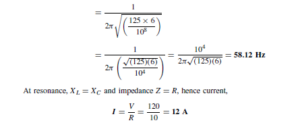
For example, a coil having a resistance of 10 Q and an inductance of 125 mH is connected in series with a 60 µF capacitor across a 120 V supply. Thus, the resonant frequency,
Q -factor
At resonance, if R is small compared with XL and XC, it is possible for VL and VC to have voltages many times greater than the supply voltage (see Figure 55.8(d), page 354).
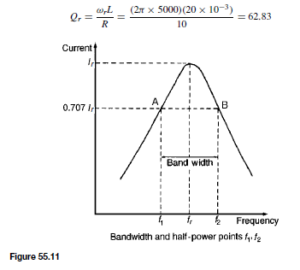
his ratio is a measure of the quality of a circuit (as a resonator or tuning device) and is called the Q-factor. It may be shown that:
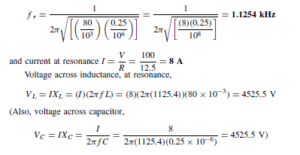
For example, a coil of inductance 80 mH and negligible resistance is connected in series with a capacitance of 0.25 µF and a resistor of resistance
12.5 Q across a 100 V, variable frequency supply. Thus, the resonant frequency
Voltage across inductance, at resonance, ![]() at resonance, the voltage across the reactance’s are 45.255 times greater than the supply voltage. Hence the Q-factor of the circuit is 45.255
at resonance, the voltage across the reactance’s are 45.255 times greater than the supply voltage. Hence the Q-factor of the circuit is 45.255
Bandwidth
Selectivity
Selectivity is the ability of a circuit to respond more readily to signals of a particular frequency to which it is tuned than to signals of other frequencies. The response becomes progressively weaker as the frequency departs from the resonant frequency. The higher the Q-factor, the narrower the bandwidth and the more selective is the circuit. Circuits having high Q-factors (say, in the order of 100 to 300) are therefore useful in communications engineering. A high Q-factor in a series power circuit has disadvantages in that it can lead to dangerously high voltages across the insulation and may result in electrical breakdown.
For more on Q-factor, bandwidth and selectivity, see Chapter 68.
Power in a.c. circuits
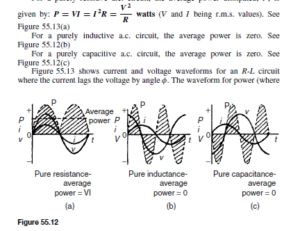
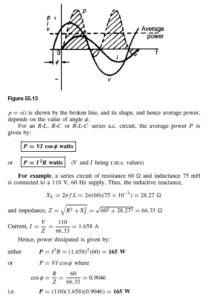
In Figures 55.12(a) – (c), the value of power at any instant is given by the product of the voltage and current at that instant, i.e. the instantaneous power, p D vi, as shown by the broken lines.
For a purely resistive a.c. circuit, the average power dissipated, P, is
Power triangle and power factor
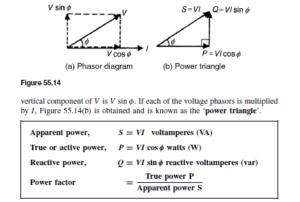
Figure 55.14(a) shows a phasor diagram in which the current I lags the applied voltage V by angle ˇ. The horizontal component of V is V cos ˇ and the
For more on the power triangle, see Chapter 66, page.
For sinusoidal voltages and currents,

