Data Logging

Data Logging

Data logging is the automatic recording of data as it is produced. A process is monitored continuously by instruments and the readings are recorded. When a computer is used the sensors are usually connected to an interface board which in turn is connected to the computer. As data is produced by the instruments it is stored by the computer on magnetic tape or disc. The data can then be analysed later.

Gathering data for a data logging system is called data acquisition.

Data Logging Fig.3 A simple data logging system

In some data logging applications the data is displayed as it is being recorded:

1 As a set of numbers on a printer (as in Fig.6).

2 As a graph produced on a drum plotter or a chart recorder.

3 As a constantly changing screen display.

Figure .4 shows the screen display for a data logging system to monitor conditions inside a petrochemical plant. Sensors monitor the temperature in a boiler, the flow at two critica1 points and the output produced. Each of the vertical columns on the graphs represents one minute. After each minute the four values are recorded for future analysis by the computer. At the same time the four graphs on the screen are each adjusted to take account of the new reading.

Data Logging 2

Fig.4 Screen using graphs to show the a data for logging system as it is being recorded.The system show is installed at a petrochemical plant (By kind permission of Solartron Instruments).

Examples of data logging

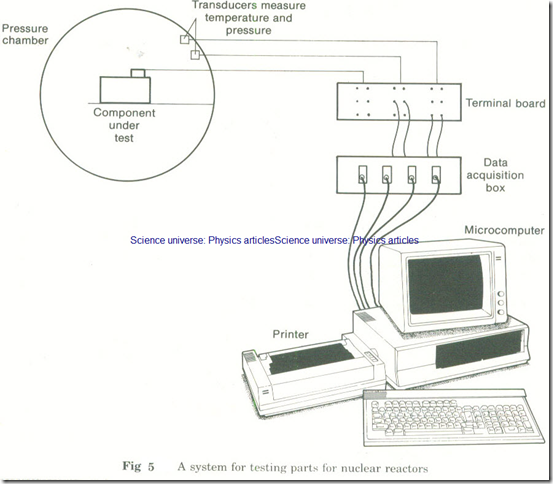
A system for testing parts for nuclear reactors

Some of the working parts in a nuclear reactor have to withstand very high temperatures and pressures. The central electricity generating board has built pressure chamber at the marchwood engineering laboratories.these chambers are used to test parts for the reactors to see if they work under the condition found in areactor.the pressure and temperature in each chamber can be changed to simulate reactors.

The temperatures and pressure and other values in the chambers are measured using devices called transducers in the chamber send analogue singles to acquisition box’, This contains analogue-to-digital converters and can be seen under the printer at the right of the photograph (Fig.6). From here digital signals are sent to a microcomputer which prints the values and stores them on a floppy disc. The data can then be analysed later.

A hotel call logging system

This is a very different type of data logging. Callstar (produced by Feeline Management Ltd) is a system which uses a microcomputer to log telephone calls made by hotel guests. The system is connected to the hotel’s exchange. For any call made from a hotel room it can automatically record:

1 The room from which the call is made.

2 The number which has been dialled.

3 The length of time the call takes.

From this information the system can calculate the costs of calls and decide who is to be charged. The computer produces various reports for the hotel management. It also produces an up-to-date telephone bill as the guest checks out see figure 7 .


Data Logging 3

Fig.5 A system for testing parts for nuclear reactors


Data Logging 4

Fig.6 The computer and the data acquisition box in a system to test parts for nuclear reactors (By kind permission of Marchwood Engineering Laboratories)


Data Logging 5

Fig.7 the guest’s telephone bill us produced by the computer (By kind permission of Feeline Management Ltd)

Leave a comment

Your email address will not be published. Required fields are marked *

Data Logging

Data Logging

Data logging is the automatic recording of data as it is produced. A process is monitored continuously by instruments and the readings are recorded. When a computer is used the sensors are usually connected to an interface board which in turn is connected to the computer. As data is produced by the instruments it is stored by the computer on magnetic tape or disc. The data can then be analysed later.

Gathering data for a data logging system is called data acquisition.

Data Logging Fig.3 A simple data logging system

In some data logging applications the data is displayed as it is being recorded:

1 As a set of numbers on a printer (as in Fig.6).

2 As a graph produced on a drum plotter or a chart recorder.

3 As a constantly changing screen display.

Figure .4 shows the screen display for a data logging system to monitor conditions inside a petrochemical plant. Sensors monitor the temperature in a boiler, the flow at two critica1 points and the output produced. Each of the vertical columns on the graphs represents one minute. After each minute the four values are recorded for future analysis by the computer. At the same time the four graphs on the screen are each adjusted to take account of the new reading.

Data Logging 2

Fig.4 Screen using graphs to show the a data for logging system as it is being recorded.The system show is installed at a petrochemical plant (By kind permission of Solartron Instruments).

Examples of data logging

A system for testing parts for nuclear reactors

Some of the working parts in a nuclear reactor have to withstand very high temperatures and pressures. The central electricity generating board has built pressure chamber at the marchwood engineering laboratories.these chambers are used to test parts for the reactors to see if they work under the condition found in areactor.the pressure and temperature in each chamber can be changed to simulate reactors.

The temperatures and pressure and other values in the chambers are measured using devices called transducers in the chamber send analogue singles to acquisition box’, This contains analogue-to-digital converters and can be seen under the printer at the right of the photograph (Fig.6). From here digital signals are sent to a microcomputer which prints the values and stores them on a floppy disc. The data can then be analysed later.

A hotel call logging system

This is a very different type of data logging. Callstar (produced by Feeline Management Ltd) is a system which uses a microcomputer to log telephone calls made by hotel guests. The system is connected to the hotel’s exchange. For any call made from a hotel room it can automatically record:

1 The room from which the call is made.

2 The number which has been dialled.

3 The length of time the call takes.

From this information the system can calculate the costs of calls and decide who is to be charged. The computer produces various reports for the hotel management. It also produces an up-to-date telephone bill as the guest checks out see figure 7 .


Data Logging 3

Fig.5 A system for testing parts for nuclear reactors


Data Logging 4

Fig.6 The computer and the data acquisition box in a system to test parts for nuclear reactors (By kind permission of Marchwood Engineering Laboratories)


Data Logging 5

Fig.7 the guest’s telephone bill us produced by the computer (By kind permission of Feeline Management Ltd)
Leave a comment

Your email address will not be published. Required fields are marked *