Flowcharts-System Flowcharts
FLOWCHARTS
A flowchart is a diagram representing the operations involved in a process. It consists of a combination of:
1 Symbols (or boxes) to represent the operations. There are standard shapes for the different types of operations which should be remembered and used.
2 Messages in the symbols. These state briefly what the operations are.
3 Annotation This is the explanation given in the margin (usually at the right of
the flowchart).
It allows the messages in the symbols to be kept brief.
4 Lines connecting the symbols. These lines may have arrows.
There are two completely different types of flowchart:
1 System flowcharts. These represent the operations on data in a system.
2 Flowcharts of algorithms. These represent the sequence of operations and include program flowchart .
SYSTEM FLOWCHARTS
A system flowchart (or data flowchart) is a diagram representing the operations on data in an information processing system.
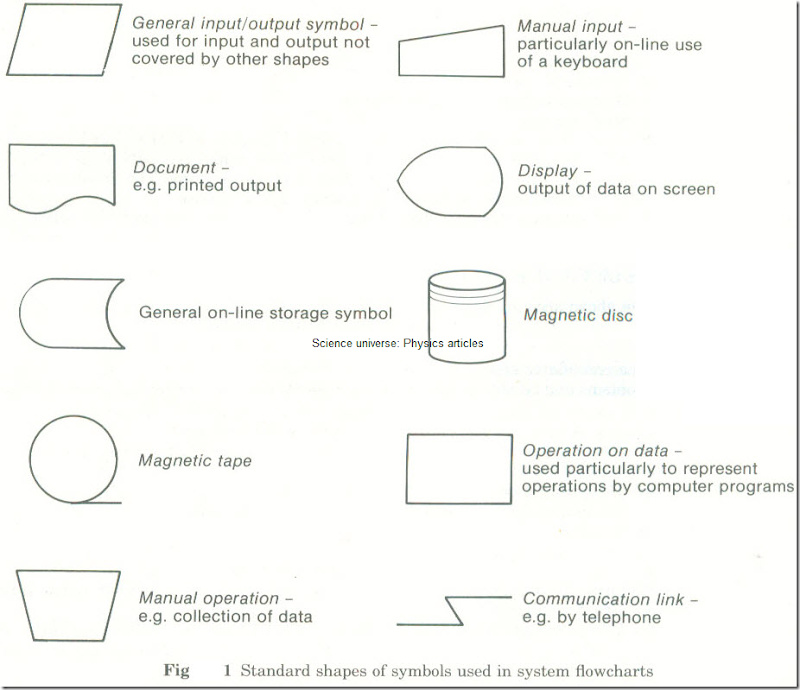
On a system flowchart the symbols represent data or operations on data. Usually the symbol used for each data operation looks like the medium involved (Fig. 1).
 Fig. 1 Standard shapes of symbols used in system flowcharts
The general symbols for input/output and for on-line storage can be used for methods which do not have their own shapes. They can be used for all inputoutput or storage but syllabuses seem to prefer the style shown in Figures 3 and 4.
If the general symbols are used, they usually have the device used written in the strip along the bottom, as in Fig .2.
Fig.2 Example of the use of the general symbols for input/output and for on-line storage
Drawing system flowcharts
1 System flowcharts are quite different from other flowcharts:
(a) In a system flowchart the arrows and lines show the flow of data within the system. They
do not necessarily show the order in which operations are carried out.
(b) A system flowchart does not have a START symbol or a STOP symbol.
(c) System flowcharts should not show details of how computer programs work. They should
not contain decision boxes. Usually each process box shows the operation of a complete program.
2 There are no definite rules about the layout of a system flowchart but it is a good idea to:
(a) Represent programs in process boxes (rectangles) in order down the middle of the page.
(b) Show data collection and input at the top left.
(c) Show files and output towards the left or right of the page.
(d) Put annotation (comments) at the far right of the page.
Examples of system flowcharts
1 A payroll system for a firm. A firm pays some of its employees weekly on the basis of the
number of hours worked The employees punch a clock card on arriving at work and on leaving.
Data from these is prepared on magnetic tape encoders. Some of the employees are paid
through the bank and some in cash . The system flowchart in Fig .3 is a simplified version of the computerized system used
Fig.3 System flowchart for a payroll application
2 A pupil records system for a school. The system is described first in words and then in the
flowchart (Fig.4), so that you can make a comparison.
(a) Hardware. The school office has a microcomputer with both a hard and a floppy disc unit
and a printer. There is also a modem connected to an outside telephone line.
(b) Software. The records are maintained using a database program.
There are also separate programs for tasks such as:
(i) Validating data as it is typed in,
(ii) Updating all the records at the beginning of each year so that first year pupils become
second year pupils, etc.
(iii) Connecting the microcomputer to the local authority’s main computer.
(c) (i) Collection of data. Part of the data on the pupils comes from the local authority’s main
computer. The rest comes from forms completed by the pupils and their teachers.
(ii) Checking of data. The forms are checked for accuracy by the teachers.
Data is also validated by the computer as it is input.
(iii) Input of data. Input of the large amount of data from the forms at the start of the year is
achieved by using a local computer bureau.
Data from the local authority’s computer is input direct using the modem. Minor changes to
the data during the year are made by the office staff.
(d) Communication. Data communication with the main computer is achieved using modems.
The school’s microcomputer acts as an intelligent terminal to the main computer.
(e) Files. The main data file includes-for each pupil at the school-
name, year of entry, date of birth, address, phone numbers, medical problems, test results
from the previous school, year of study, subjects studied, form tutor.
Files are updated at the start of the year by:
(i) Copying the records of leavers to another file.
(ii) Deleting leavers from the main file.
(iii) Changing the year of study, subjects studied and form tutor for those staying on.
(iv) Adding new pupils.
Small changes are also carried out throughout the year by the office staff on the basis of
information supplied by the teachers.
(f) Processing. Processing operations which can be carried out include:
(i) Calculating statistics on numbers of pupils in a particular category.
Fig.4 System flowchart for a school pupil records system
(ii) Working out lists in a chosen order, for example, lists of pupils as in the example in the introduction to this topic .
(g) Output. Output can be produced on the printer and/or a screen.
Most lists and tables of statistics are produced on the printer. However, the screen may be used
for enquiries about individual pupils.


