Utility Company Interfacing
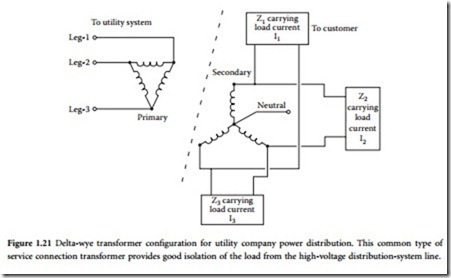
Most utility company-to-customer connections are the delta-wye type shown in Figure 1.21. This trans- former arrangement usually is connected with the delta side facing the high voltage and the wye side facing the load. This configuration provides good isolation of the load from the utility and somewhat retards the transmission of transients from the primary to the secondary windings. The individual three- phase loads are denoted in the figure by Zl, Z2, and Z3. They carry load currents as shown. For a wye-con- nected system, it is important that the building neutral lead is connected to the midpoint of the trans- former windings, as shown. The neutral line provides a path for the removal of harmonic currents that may be generated in the system as a result of rectification of the secondary voltages.
In some areas, an open-delta arrangement is used by the utility company to supply power to custom- ers. The open-delta configuration is shown in Figure 1.22. Users often encounter problems when operating sensitive three-phase loads from such a connection because of poor voltage-regulation characteristics during varying load conditions. The open-delta configuration is also subject to high third-harmonic con- tent and transient propagation. The three loads and their respective load currents are shown in the diagram.
Other primary power connection arrangements are possible, such as wye-to-wye or delta-to-delta. Like the delta-to-wye configuration, they are not susceptible to the problems that may be experienced with the open-delta (or V-V) service.
The open-delta system can develop a considerable imbalance among the individual phases in either voltage or phase or both. This can introduce a strong 120 Hz ripple frequency in three-phase power sup- plies, which are designed to filter out a 360 Hz ripple. The effects of this 120 Hz ripple can be increased noise in the supply and possible damage to protection devices across the power-supply chokes. Depend- ing on the loading of an open-delta transformer, high third-harmonic energy can be transferred to the load, producing transients of up to 300% of the normal voltage. The result could be severely strained rectifiers, capacitors, and inductors in the power supply as well as additional output noise of the supply.
Phase-to-Phase Balance
The phase-to-phase voltage balance of a utility company line is important at most types of facilities, not only because of the increased power-supply ripple that it can cause, but also because of the possible heat- ing effects. Even simple three-phase devices such as motors should be operated from a power line that is well balanced, preferably within 1%. Studies have shown that a line imbalance of only 3.5% can produce a 25% increase in the heat generated by a three-phase motor. A 5% imbalance can cause a 50% increase in heat, which is potentially destructive. Similar heating also can occur in the windings of three-phase power transformers used in industrial equipment.
Phase-to-phase voltage balance can be measured accurately over a period of several days with a slow- speed chart recorder or electronic utility-line analyzer. The causes of imbalanced operation are generally large, single-phase power users on local distribution lines. Uneven currents through the utility company power-distribution system will result in uneven line-to-line voltages at the customer’s service drop entrance.
Load Fault Protection
Fuses and circuit breakers are the two most common methods used in electronic equipment to prevent system damage in the event of a component failure. Although it is hardly new technology, there are still a lot of misconceptions about fuse and circuit-breaker ratings and operation.
1.4.6.1 Fuses
Fuses are rated according to the cur- rent they can pass safely. This may give the wrong idea — that excessive current will cause a fuse to blow. Rather, the cause is power dissipation in the form of heat. Put in more familiar terms, it is the I 2R loss across the fuse element that causes the linkage to melt. The current rat- ing of a given device, however, is not the brick-wall-protection value that many service people think it is. Con- sider the graph shown in Figure 1.23,
each type of device is a function of both current and time. For example, a slow-blow fuse will allow approximately 6 times the rated current through a circuit for a full second before opening. Such delay characteristics have the benefit of offering protection against nuisance blowing because of high inrush currents during system startup. This feature, however, comes with the price of possible exposure to sys- tem damage in the event of a component failure.
Circuit Breakers
Circuit breakers are subject to similar current let-through constraints. Figure 1.24 illustrates device load current as a percentage of breaker rating vs. time. The A and B curves refer to breaker load capacity product divisions. Note the variations possible in trip time for the two classifications. The minimum clearing time for the A group (the higher classification devices) is 1 s for a 400% overload. Similar to fuses, these delays are designed to prevent nuisance tripping caused by normally occurring current surges from (pri- marily) inductive loads. Most circuit breakers are designed to carry 100% of their rated load continuously without tripping. They normally are specified to trip at between 101 and 135% of rated load after a period of time determined by the manufacturer. In this example, the must-trip point at 135% is 1 hour.
Circuit breakers are available in both thermal and magnetic designs. Magnetic protectors offer the benefit of relative immunity to changes in ambient temperature. Typically, a magnetic breaker will operate over a temperature range of –40°C to +85°C without significant variation of the trip point. Time delays usually are provided for magnetic breakers to prevent nuisance tripping caused by startup currents from inductive loads. Trip-time delay ratings range from near instantaneous (under 100 ms) to slow (10 to 100 s).
Semiconductor Fuses
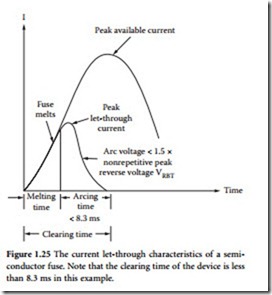
The need for a greater level of protection for semiconductor-based systems led to the development of semiconductor fuses. Figure 1.25 shows the clearing characteristics of a typical fuse of this type. The total clearing time of the device consists of two equal time segments: the melting time and the arcing time. The rate of current decrease during the arcing time must be low enough that high induced voltages, which could destroy some semiconductor components, are not generated.
Application Considerations
Although fuses and circuit breakers are a key link in preventing equipment damage during the occurrence of a system fault, they are not without some built-in disad- vantages. Lead alloy fuses work well and are the most common protection device found, but because the current-interrupt- ing mechanism is dependent on the melt- ing of a metal link, their exact blow point is not constant. The interrupting current may vary, depending on the type and size of fuse clip or holder, conductor size, phys- ical condition of the fuse element, extent of vibration present, and ambient temperature. Figure 1.26 illustrates the effects of ambient temperature on blowing time and
tive loads or tungsten filament lamps are energized. The resistance of a tungsten lamp is high when it is hot, but low when it is cold. A current surge of as much as 15 times the rated steady-state value may occur when the lamp is energized (pulse duration approximately 4 ms).
Transformer inrush currents can measure as high as 30 times the normal rated current for newer types of transformers that have grain-oriented high silicon steel cores. These transformer designs are attractive because of their favorable size and weight characteristics. Older transformers of more conven- tional design typically exhibit an inrush current approximately 18 times greater than the steady-state value. This transient current surge reaches its peak in the first half-cycle of applied ac power and decreases with each successive half-cycle. Such transients are relatively insensitive to the load placed on the secondary. The transient may, in fact, be smaller when the transformer is loaded than unloaded. A worst-case turn-on current surge will not occur every time the transformer is energized. Among the determining factors involved is the magnitude of the applied voltage at the instant the transformer is con- nected. Minimum transient energy occurs when the transformer is switched on at the zero-crossing point of the sine wave.
The magnitude of the turn-on current surge of an ac-to-dc power supply is determined mainly by the transformer transient and the capacitive load placed after the rectifier elements. Large filter capacitors commonly found in low-voltage, high-current supplies can place severe stress on the rectifiers and trans- former. A fully discharged capacitor appears as a virtual short circuit when power is first applied. Some form of surge-limiting circuit often is provided for power supplies containing more than 10,000 μF total capacitance.
The surge current of an ac motor is spread over tenths of a second, rather than milliseconds, and varies considerably with the load connected to the unit. Table 1.5 lists typical motor surge currents for various types of devices. Note that the single-phase induction motor has the highest surge rating (7 times the running value for a period of 750 ms). Three-phase motors exhibit a relatively low-surge current dur- ing startup (350% for 167 ms).
Delay-Trip Considerations
The occurrence of turn-on surges for inductive loads, ac-to-dc power supplies, and tungsten filament lamps dictates the installation of protective devices that exhibit delayed-trip characteristics that match the given load. The problem, however, is that high-surge currents of brief duration — not related to turn- on activities — can occur without tripping the circuit breaker or opening the fuse element. The result may be damage to other circuit devices, such as semiconductors. To provide full protection to an elec- tronic system, the overload withstand characteristics of all components should match. This is not always an easy goal to accomplish.
For example, consider a simple SCR-controlled ac-to-dc power supply. The transformer will set the upper limit on surge current presented to the protective device and the SCR (assuming light capacitive loading). If that surge is 18 times the normal steady-state current for a period of 8 ms, then a protective device must be selected that will allow the surge to pass without tripping. An SCR must be selected for the circuit, therefore, that can withstand at least 18 times the normal rated current for 8 ms. If not, the SCR will become the weak link in the system, not the protective device.
Measuring AC Power
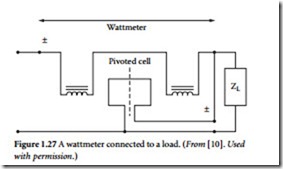
Measuring the average power delivered to a ± load requires measurement of the rms values of voltage and current, as well as the power factor [10]. This is accomplished by an electro-dynamometer-type wattmeter, shown in Figure 1.27. The current in the high-resistance pivoted coil is proportional to the voltage across the load. The current
field across the cylinder of rotation of the pivoted coil. The torque on the pivoted coil is proportional to the product of the magnetic field strength and the current in the pivoted coil. If the current in the pivoted coil is negligible compared to that in the load, then the torque becomes essentially proportional to the product of the voltage across the load (equal to that across the pivoted coil) and the current in the load (essentially equal to that through the energizing coil of the electromagnet). The dynamics of the pivoted coil together with the restraining spring, at ac power frequencies, ensures that the angular displacement of the pivoted coil is proportional to the average of the torque or, equivalently, the average power.
One of the most common electrical
instruments is the induction-type watt-hour meter, which measures the energy delivered to a load. In this design, the pivoted coil is replaced by a rotating conducting (usually aluminum) disk, as shown in Figure 1.28. An induced eddy current in the disk replaces the pivoted coil current in its interaction with the load-current-established magnetic field. After compensating for the less-than-ideal nature of the electrical elements making up this type of meter, the result is that the disk rotates at a
rate proportional to the average power of the load, and the rotational count is proportional to the energy delivered to the load.
At frequencies above the ac power frequency, and — in some instances — at the ac power frequen- cies, electronic instruments are used to measure power and energy. These systems are based on a variety of basic digital measurement techniques.
Digital Measurement Techniques
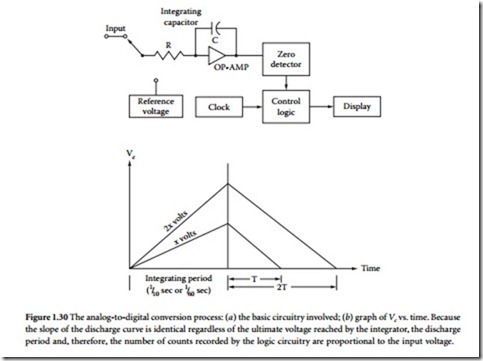
Figure 1.29 shows a generalized block diagram of a digital voltmeter/ammeter. Conversion of an input voltage to a digital equivalent can be accomplished in one of several ways. The dual-slope conversion method (also know as double-integration) is one of the more popular techniques. Figure 1.30 illustrates the dual-slope conversion process. Vin represents the input voltage (the voltage to be measured). VREF is a reference voltage with a polarity opposite that of the measured voltage, supplied by the digital conversion circuit. Capacitor C1 and operational amplifier U1 constitute an integrator. S1 is an electronic switch that is initially in the position shown. When the meter terminals are first connected to the circuit, the sample voltage is applied to the input of the integrator for a specified period of time, called the integration period. The integration period is usually related to the 60 Hz line frequency; integration periods of 1/60th of a second are common. S1 is an electronic switch that is initially in the position shown. When the meter ter- minals are first connected to the circuit, the sample voltage is applied to the input of the integrator for a specified period of time, called the integration period. The integration period is usually related to the 60 Hz line frequency; integration periods of 1/60th of a second and 1/10th of a second are common. The output signal of the integrator is a voltage determined by the resistor-capacitor (RC) time constant of R1 and C1. Because of the nature of the integrator, the maximum voltage (the voltage at the end of the inte- gration period) is proportional to the voltage being measured. At the end of the integration period, switch S1 is moved to the other position (VREF) and a voltage of opposite polarity to the measured voltage is applied. The capacitor is then discharged to zero. As shown in the figure, the discharge interval is directly proportional to the maximum voltage, which, in turn, is proportional to the applied voltage at the input terminals.
At the same time that the integration interval ends and the discharge interval begins, a counter in the meter begins counting pulses generated by a clock circuit. When the voltage reaches zero, the counter stops. The number of pulses counted is, therefore, proportional to the discharge period. This count is converted to a digital number and displayed as the measured quantity. Although this method works well, it is somewhat slow, so many microcomputer-based meters use a variation called multislope integration.


