Blocked Rotor Test
It is also known as locked-rotor or short-circuit test. This test is used to find–
1. short-circuit current with normal voltage applied to stator
2. power factor on short-circuit Both the values are used in the construction of circle diagram
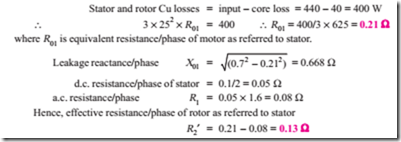
3. total leakage reactance X 01 of the motor as referred to primary (i.e. stator)
4. total resistance of the motor R01 as referred to primary. In this test, the rotor is locked (or allowed very slow rotation)
and the rotor windings are short-circuited at slip-rings, if the motor has a wound rotor. Just as in the case of a short-circuit test on a transformer, a reduced voltage (up to 15 or 20 per cent of normal value) is applied to the stator terminals and is so adjusted that full-load current flows in the stator. As in this case s = 1, the equivalent circuit of the motor is exactly like a transformer, having a short- circuited secondary. The values of current, voltage and power input on short-circuit are measured by the ammeter, voltmeter and wattmeter connected in the circuits as before. Curves connecting the above quantities may also be drawn by taking two or three additional sets of readings at progressively reduced voltages of the stator.
(a) It is found that relation between the short-circuit current and voltage is approximately a straight line. Hence, if V is normal stator voltage, V s the short-circuit voltage (a fraction of V ), then short-circuit or standstill rotor current, if normal voltage were applied to stator, is found from the relation
Construction of the Circle Diagram
Circle diagram of an induction motor can be drawn by using the data obtained from (1) no-load (2) short-circuit test and (3) stator resistance test, as shown below.
Step No. 1
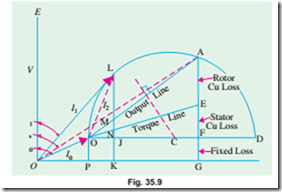
From no-load test, I0 and f0 can be calculated. Hence, as shown in Fig. 35.9, vector for I0 can be laid off lagging f0 behind the applied voltage V .
Step No. 2
Next, from blocked rotor test or short-circuit test, short-circuit current ISN corresponding to normal voltage and fS are found. The vector OA represents ISN = (ISV /V S ) in Windings inside a motor magnitude and phase. Vector O¢A represents rotor current I2¢ as referred to stator.
Clearly, the two points O¢ and A lie on the required circle. For finding the centre C of this circle, chord O¢A is bisected at right angles–its bisector giving point C. The diameter O¢D is drawn perpendicular to the voltage vector.
As a matter of practical contingency, it is recommended that the scale of current vectors should be so chosen that the diameter is more than 25 cm, in order that the performance data of the motor may be read with reason- able accuracy from the circle diagram. With centre C and radius = CO¢, the It should be noted that as the voltage vector is drawn vertically, all vertical distances represent the active or power or energy components of the currents.
For example, the vertical component O¢P of no-load current OO¢ represents the no-load input, which supplies core loss, friction and windage loss and a negligibly small amount of stator I2R loss. Similarly, the vertical component AG of short-circuit current OA is proportional to the motor input on short- circuit or if measured to a proper scale, may be said to equal power input.
Step No. 3
Torque line. This is the line which separates the stator and the rotor copper losses. When the rotor is locked, then all the power supplied to the motor goes to meet core losses and Cu losses in the stator and rotor windings. The power input is proportional to A G. Out of this, FG (= O¢P) represents fixed losses i.e. stator core loss and friction and windage losses. AF is proportional to the sum of the stator and rotor Cu losses. The point E is such that
Hence, it is seen that, at least, theoretically, it is possible to obtain all the characteristics of an induction motor from its circle diagram. As said earlier, for drawing the circle diagram, we need (a) stator-resistance test for separating stator and rotor Cu losses and (b) the data obtained from (i) no- load test and (ii) short-circuit test.


